Davenport, FL
Demographics And Statistics
Living In Davenport, Florida Summary
Life in Davenport research summary. HomeSnacks has been using Saturday Night Science to research the quality of life in Davenport over the past nine years using Census, FBI, Zillow, and other primary data sources. Based on the most recently available data, we found the following about life in Davenport:
The population in Davenport is 11,660.
The median home value in Davenport is $347,962.
The median income in Davenport is $65,157.
The cost of living in Davenport is 105 which is 1.1x higher than the national average.
The median rent in Davenport is $2,875.
The unemployment rate in Davenport is 2.7%.
The poverty rate in Davenport is 18.0%.
The average high in Davenport is 83.4° and the average low is 62.1°.
Davenport SnackAbility
Overall SnackAbility
Davenport, FL Crime Report
Crime in Davenport summary. We use data from the FBI to determine the crime rates in Davenport. Key points include:
There were 73 total crimes in Davenport in the last reporting year.
The overall crime rate per 100,000 people in Davenport is 418.2 / 100k people.
The violent crime rate per 100,000 people in Davenport is 74.5 / 100k people.
The property crime rate per 100,000 people in Davenport is 343.7 / 100k people.
Overall, crime in Davenport is -80.27% below the national average.
Total Crimes
Below National Average
Crime In Davenport Comparison Table
| Statistic | Count Raw |
Davenport / 100k People |
Florida / 100k People |
National / 100k People |
|---|---|---|---|---|
| Total Crimes Per 100K | 73 | 418.2 | 1,687.5 | 2,119.2 |
| Violent Crime | 13 | 74.5 | 267.1 | 359.0 |
| Murder | 0 | 0.0 | 3.9 | 5.0 |
| Robbery | 0 | 0.0 | 38.2 | 61.0 |
| Aggravated Assault | 10 | 57.3 | 197.1 | 256.0 |
| Property Crime | 60 | 343.7 | 1,420.4 | 1,760.0 |
| Burglary | 17 | 97.4 | 152.5 | 229.0 |
| Larceny | 40 | 229.1 | 1,144.9 | 1,272.0 |
| Car Theft | 3 | 17.2 | 123.0 | 259.0 |
Davenport, FL Cost Of Living
Cost of living in Davenport summary. We use data on the cost of living to determine how expensive it is to live in Davenport. Real estate prices drive most of the variance in cost of living around Florida. Key points include:
The cost of living in Davenport is 105 with 100 being average.
The cost of living in Davenport is 1.1x higher than the national average.
The median home value in Davenport is $347,962.
The median income in Davenport is $65,157.
Davenport's Overall Cost Of Living
Higher Than The National Average
Cost Of Living In Davenport Comparison Table
| Living Expense | Davenport | Florida | National Average | |
|---|---|---|---|---|
| Overall | 105 | 97 | 100 | |
| Services | 99 | 96 | 100 | |
| Groceries | 96 | 99 | 100 | |
| Health | 92 | 98 | 100 | |
| Housing | 120 | 96 | 100 | |
| Transportation | 96 | 97 | 100 | |
| Utilities | 91 | 95 | 100 | |
Davenport, FL Weather
The average high in Davenport is 83.4° and the average low is 62.1°.
There are 74.5 days of precipitation each year.
Expect an average of 48.1 inches of precipitation each year with 0.0 inches of snow.
| Stat | Davenport |
|---|---|
| Average Annual High | 83.4 |
| Average Annual Low | 62.1 |
| Annual Precipitation Days | 74.5 |
| Average Annual Precipitation | 48.1 |
| Average Annual Snowfall | 0.0 |
Average High
Days of Rain
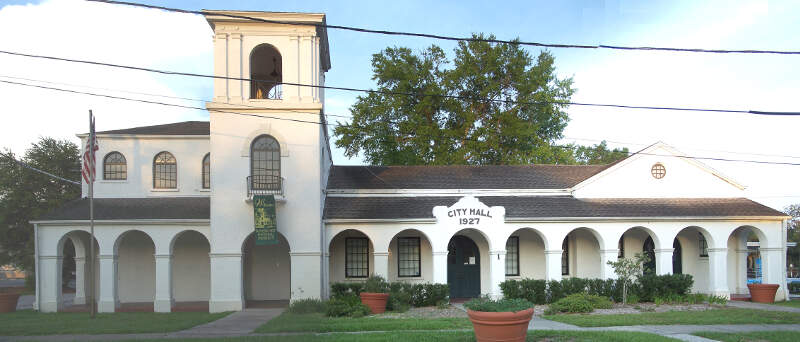
Davenport, FL Photos
Rankings for Davenport in Florida


Locations Around Davenport
Map Of Davenport, FL
Best Places Around Davenport
Hunters Creek, FL
Population 21,255
Horizon West, FL
Population 62,152
Buenaventura Lakes, FL
Population 32,310
Lake Wales, FL
Population 16,365
Auburndale, FL
Population 17,438
Winter Haven, FL
Population 52,846
Kissimmee, FL
Population 79,504
Poinciana, FL
Population 71,665
Four Corners, FL
Population 60,443
Davenport Demographics And Statistics
Population over time in Davenport
The current population in Davenport is 11,660. The population has increased 315.7% from 2010.
| Year | Population | % Change |
|---|---|---|
| 2023 | 11,660 | 13.8% |
| 2022 | 10,246 | 13.2% |
| 2021 | 9,049 | 67.0% |
| 2020 | 5,420 | 15.8% |
| 2019 | 4,682 | 13.1% |
| 2018 | 4,140 | 13.0% |
| 2017 | 3,665 | 9.1% |
| 2016 | 3,359 | 7.1% |
| 2015 | 3,137 | 3.8% |
| 2014 | 3,022 | 2.8% |
| 2013 | 2,941 | 1.4% |
| 2012 | 2,901 | 1.4% |
| 2011 | 2,860 | 2.0% |
| 2010 | 2,805 | - |
Race / Ethnicity in Davenport
Davenport is:
22.0% White with 2,566 White residents.
20.1% African American with 2,346 African American residents.
0.0% American Indian with 0 American Indian residents.
2.9% Asian with 335 Asian residents.
0.0% Hawaiian with 0 Hawaiian residents.
0.1% Other with 16 Other residents.
2.9% Two Or More with 334 Two Or More residents.
52.0% Hispanic with 6,063 Hispanic residents.
| Race | Davenport | FL | USA |
|---|---|---|---|
| White | 22.0% | 51.4% | 58.2% |
| African American | 20.1% | 14.8% | 12.0% |
| American Indian | 0.0% | 0.1% | 0.5% |
| Asian | 2.9% | 2.8% | 5.7% |
| Hawaiian | 0.0% | 0.1% | 0.2% |
| Other | 0.1% | 0.6% | 0.5% |
| Two Or More | 2.9% | 3.5% | 3.9% |
| Hispanic | 52.0% | 26.7% | 19.0% |
Gender in Davenport
Davenport is 50.3% female with 5,864 female residents.
Davenport is 49.7% male with 5,795 male residents.
| Gender | Davenport | FL | USA |
|---|---|---|---|
| Female | 50.3% | 50.9% | 50.5% |
| Male | 49.7% | 49.1% | 49.5% |
Highest level of educational attainment in Davenport for adults over 25
9.0% of adults in Davenport completed < 9th grade.
6.0% of adults in Davenport completed 9-12th grade.
30.0% of adults in Davenport completed high school / ged.
26.0% of adults in Davenport completed some college.
7.0% of adults in Davenport completed associate's degree.
12.0% of adults in Davenport completed bachelor's degree.
8.0% of adults in Davenport completed master's degree.
1.0% of adults in Davenport completed professional degree.
1.0% of adults in Davenport completed doctorate degree.
| Education | Davenport | FL | USA |
|---|---|---|---|
| < 9th Grade | 9.0% | 5.0% | 5.0% |
| 9-12th Grade | 6.0% | 6.0% | 6.0% |
| High School / GED | 30.0% | 27.0% | 26.0% |
| Some College | 26.0% | 19.0% | 19.0% |
| Associate's Degree | 7.0% | 10.0% | 9.0% |
| Bachelor's Degree | 12.0% | 21.0% | 21.0% |
| Master's Degree | 8.0% | 9.0% | 10.0% |
| Professional Degree | 1.0% | 2.0% | 2.0% |
| Doctorate Degree | 1.0% | 1.0% | 2.0% |
Household Income For Davenport, Florida
0.4% of households in Davenport earn Less than $10,000.
3.9% of households in Davenport earn $10,000 to $14,999.
6.5% of households in Davenport earn $15,000 to $24,999.
6.3% of households in Davenport earn $25,000 to $34,999.
18.6% of households in Davenport earn $35,000 to $49,999.
26.0% of households in Davenport earn $50,000 to $74,999.
10.5% of households in Davenport earn $75,000 to $99,999.
17.0% of households in Davenport earn $100,000 to $149,999.
7.2% of households in Davenport earn $150,000 to $199,999.
3.6% of households in Davenport earn $200,000 or more.
| Income | Davenport | FL | USA |
|---|---|---|---|
| Less than $10,000 | 0.4% | 5.1% | 4.9% |
| $10,000 to $14,999 | 3.9% | 3.4% | 3.6% |
| $15,000 to $24,999 | 6.5% | 7.0% | 6.6% |
| $25,000 to $34,999 | 6.3% | 7.7% | 6.8% |
| $35,000 to $49,999 | 18.6% | 11.6% | 10.4% |
| $50,000 to $74,999 | 26.0% | 17.3% | 15.7% |
| $75,000 to $99,999 | 10.5% | 13.1% | 12.7% |
| $100,000 to $149,999 | 17.0% | 16.8% | 17.4% |
| $150,000 to $199,999 | 7.2% | 8.0% | 9.3% |
| $200,000 or more | 3.6% | 10.1% | 12.6% |


