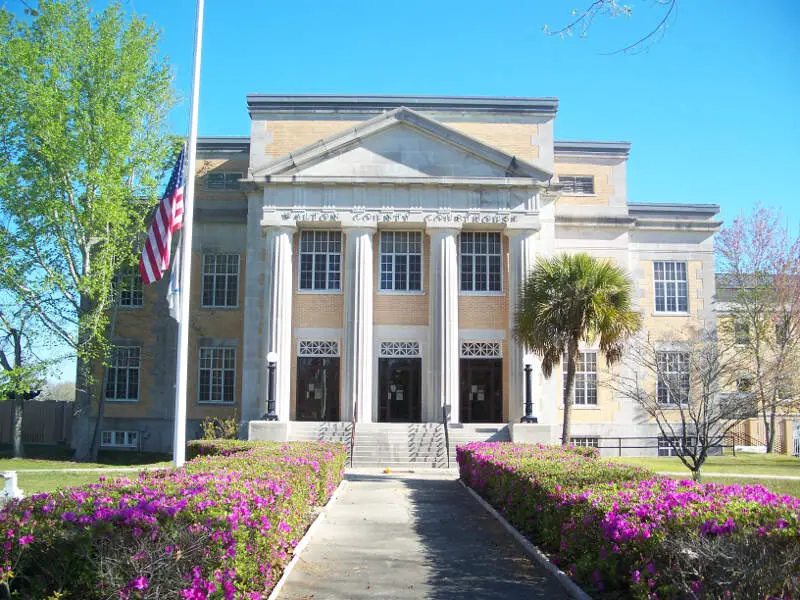
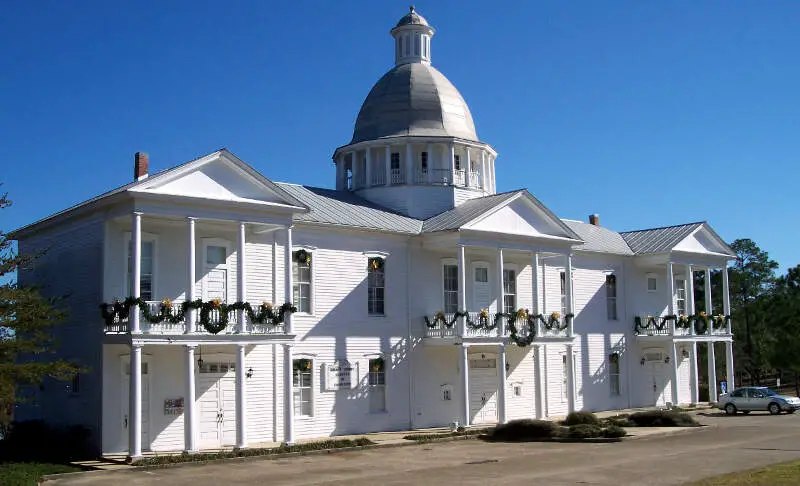
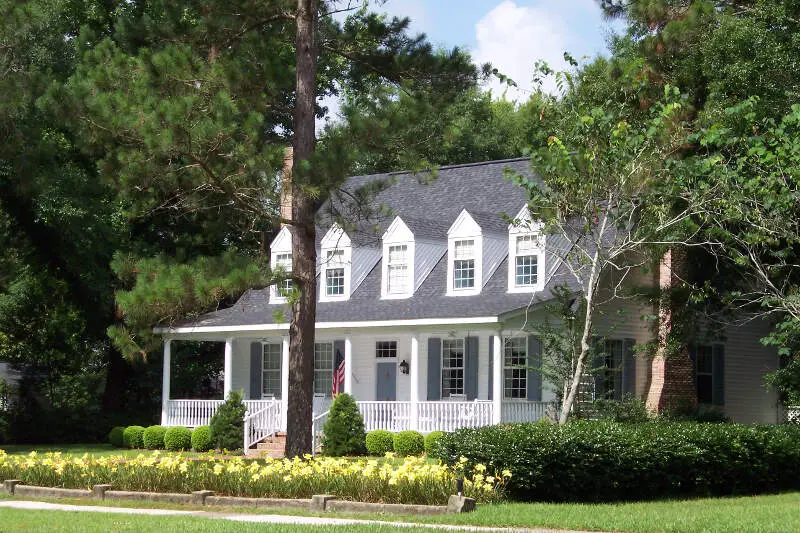
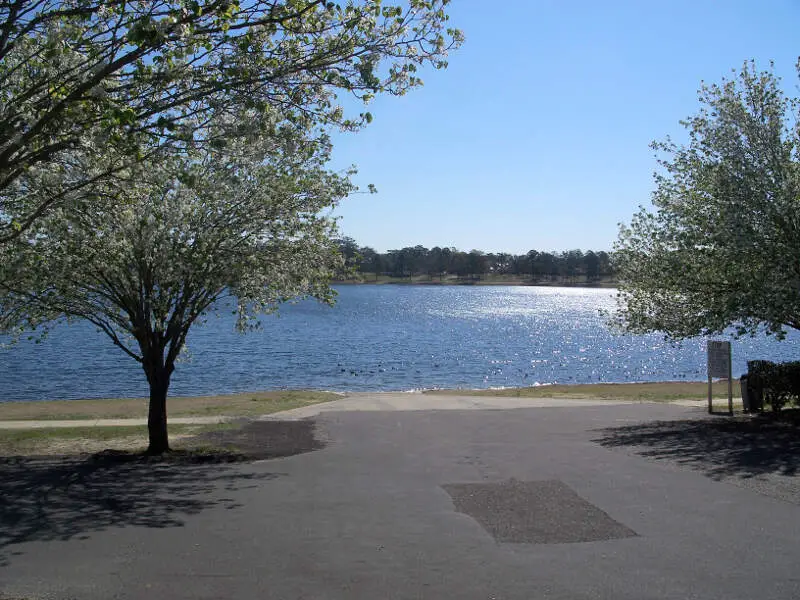
DeFuniak Springs, FL
Demographics And Statistics
Living In DeFuniak Springs, Florida Summary
Life in DeFuniak Springs research summary. HomeSnacks has been using Saturday Night Science to research the quality of life in DeFuniak Springs over the past nine years using Census, FBI, Zillow, and other primary data sources. Based on the most recently available data, we found the following about life in DeFuniak Springs:
The population in DeFuniak Springs is 6,284.
The median home value in DeFuniak Springs is $189,345.
The median income in DeFuniak Springs is $51,883.
The cost of living in DeFuniak Springs is 89 which is 0.9x lower than the national average.
The median rent in DeFuniak Springs is $821.
The unemployment rate in DeFuniak Springs is 16.6%.
The poverty rate in DeFuniak Springs is 19.4%.
The average high in DeFuniak Springs is 78.1° and the average low is 54.4°.
Defuniak Springs SnackAbility
Overall SnackAbility
Defuniak Springs, FL Crime Report
Crime in DeFuniak Springs summary. We use data from the FBI to determine the crime rates in DeFuniak Springs. Key points include:
There were 185 total crimes in DeFuniak Springs in the last reporting year.
The overall crime rate per 100,000 people in DeFuniak Springs is 2,623.0 / 100k people.
The violent crime rate per 100,000 people in DeFuniak Springs is 382.8 / 100k people.
The property crime rate per 100,000 people in DeFuniak Springs is 2,240.2 / 100k people.
Overall, crime in DeFuniak Springs is 23.77% above the national average.
Total Crimes
Above National Average
Crime In DeFuniak Springs Comparison Table
| Statistic | Count Raw |
DeFuniak Springs / 100k People |
Florida / 100k People |
National / 100k People |
|---|---|---|---|---|
| Total Crimes Per 100K | 185 | 2,623.0 | 1,687.5 | 2,119.2 |
| Violent Crime | 27 | 382.8 | 267.1 | 359.0 |
| Murder | 0 | 0.0 | 3.9 | 5.0 |
| Robbery | 3 | 42.5 | 38.2 | 61.0 |
| Aggravated Assault | 23 | 326.1 | 197.1 | 256.0 |
| Property Crime | 158 | 2,240.2 | 1,420.4 | 1,760.0 |
| Burglary | 12 | 170.1 | 152.5 | 229.0 |
| Larceny | 140 | 1,985.0 | 1,144.9 | 1,272.0 |
| Car Theft | 6 | 85.1 | 123.0 | 259.0 |
Defuniak Springs, FL Cost Of Living
Cost of living in DeFuniak Springs summary. We use data on the cost of living to determine how expensive it is to live in DeFuniak Springs. Real estate prices drive most of the variance in cost of living around Florida. Key points include:
The cost of living in DeFuniak Springs is 89 with 100 being average.
The cost of living in DeFuniak Springs is 0.9x lower than the national average.
The median home value in DeFuniak Springs is $189,345.
The median income in DeFuniak Springs is $51,883.
Defuniak Springs's Overall Cost Of Living
Lower Than The National Average
Cost Of Living In DeFuniak Springs Comparison Table
| Living Expense | DeFuniak Springs | Florida | National Average | |
|---|---|---|---|---|
| Overall | 89 | 97 | 100 | |
| Services | 105 | 96 | 100 | |
| Groceries | 93 | 99 | 100 | |
| Health | 94 | 98 | 100 | |
| Housing | 71 | 96 | 100 | |
| Transportation | 90 | 97 | 100 | |
| Utilities | 84 | 95 | 100 | |
Defuniak Springs, FL Weather
The average high in DeFuniak Springs is 78.1° and the average low is 54.4°.
There are 78.7 days of precipitation each year.
Expect an average of 63.2 inches of precipitation each year with 0.1 inches of snow.
| Stat | DeFuniak Springs |
|---|---|
| Average Annual High | 78.1 |
| Average Annual Low | 54.4 |
| Annual Precipitation Days | 78.7 |
| Average Annual Precipitation | 63.2 |
| Average Annual Snowfall | 0.1 |
Average High
Days of Rain
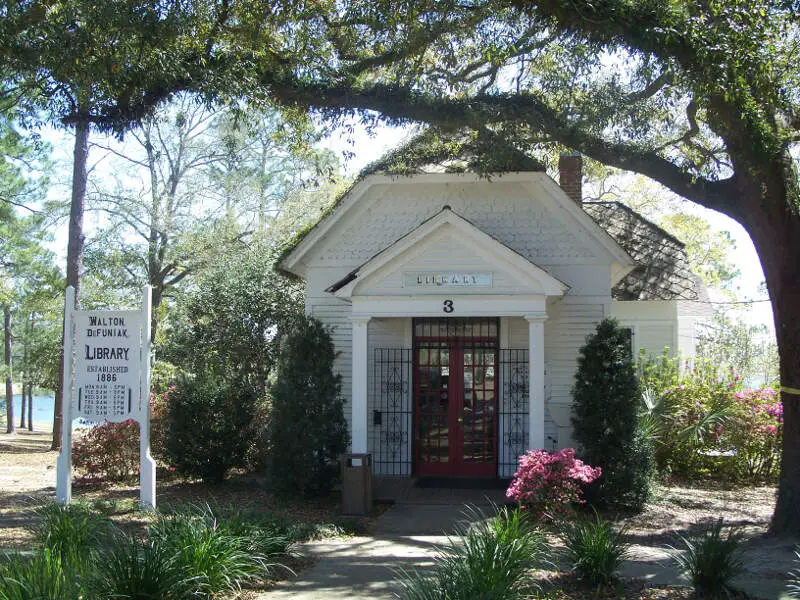
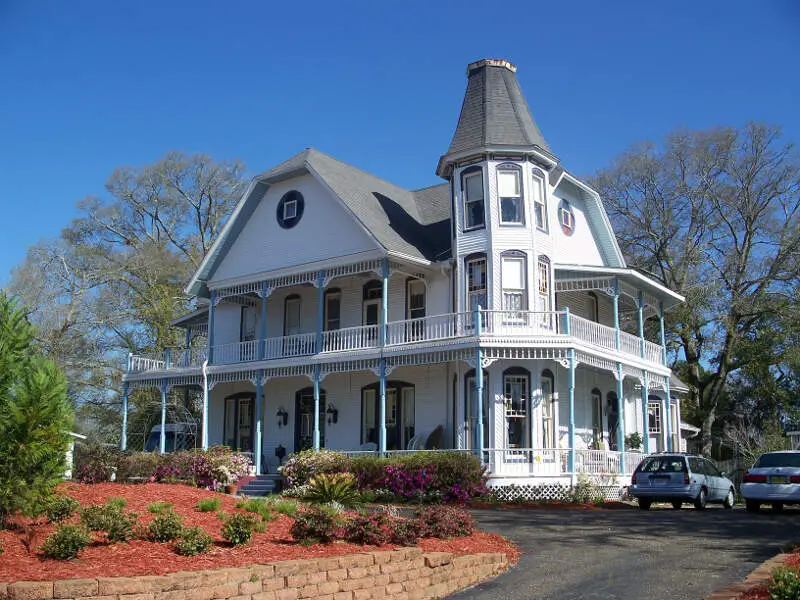
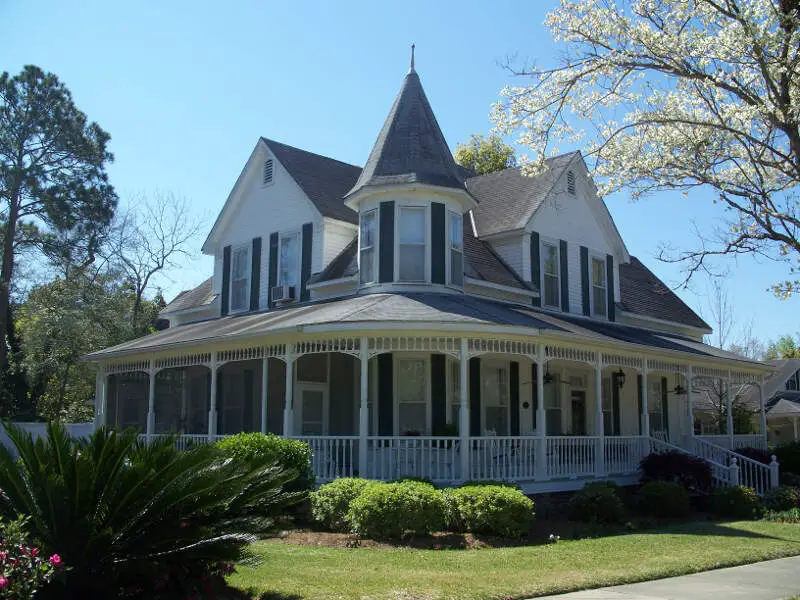
Defuniak Springs, FL Photos


Rankings for DeFuniak Springs in Florida


Locations Around DeFuniak Springs
Map Of DeFuniak Springs, FL
Best Places Around DeFuniak Springs
Niceville, FL
Population 16,043
Lynn Haven, FL
Population 19,451
Wright, FL
Population 27,233
Fort Walton Beach, FL
Population 20,956
Upper Grand Lagoon, FL
Population 17,162
Crestview, FL
Population 28,046
Destin, FL
Population 14,018
Enterprise, AL
Population 28,990
DeFuniak Springs Demographics And Statistics
Population over time in DeFuniak Springs
| Year | Population | % Change |
|---|---|---|
| 2023 | 6,284 | 3.5% |
| 2022 | 6,072 | 3.4% |
| 2021 | 5,875 | -12.3% |
| 2020 | 6,696 | 3.8% |
| 2019 | 6,448 | 3.5% |
| 2018 | 6,227 | 3.9% |
| 2017 | 5,992 | 2.0% |
| 2016 | 5,873 | 6.0% |
| 2015 | 5,543 | 2.5% |
| 2014 | 5,410 | 0.8% |
| 2013 | 5,367 | 1.1% |
| 2012 | 5,309 | 0.8% |
| 2011 | 5,265 | - |
| 2010 | 0 | - |
Race / Ethnicity in DeFuniak Springs
DeFuniak Springs is:
63.0% White with 3,957 White residents.
22.6% African American with 1,419 African American residents.
0.4% American Indian with 22 American Indian residents.
0.0% Asian with 0 Asian residents.
0.0% Hawaiian with 0 Hawaiian residents.
0.5% Other with 29 Other residents.
5.5% Two Or More with 345 Two Or More residents.
8.1% Hispanic with 512 Hispanic residents.
| Race | DeFuniak Springs | FL | USA |
|---|---|---|---|
| White | 63.0% | 51.4% | 58.2% |
| African American | 22.6% | 14.8% | 12.0% |
| American Indian | 0.4% | 0.1% | 0.5% |
| Asian | 0.0% | 2.8% | 5.7% |
| Hawaiian | 0.0% | 0.1% | 0.2% |
| Other | 0.5% | 0.6% | 0.5% |
| Two Or More | 5.5% | 3.5% | 3.9% |
| Hispanic | 8.1% | 26.7% | 19.0% |
Gender in DeFuniak Springs
DeFuniak Springs is 53.7% female with 3,376 female residents.
DeFuniak Springs is 46.3% male with 2,908 male residents.
| Gender | DeFuniak Springs | FL | USA |
|---|---|---|---|
| Female | 53.7% | 50.9% | 50.5% |
| Male | 46.3% | 49.1% | 49.5% |
Highest level of educational attainment in DeFuniak Springs for adults over 25
2.0% of adults in DeFuniak Springs completed < 9th grade.
14.0% of adults in DeFuniak Springs completed 9-12th grade.
33.0% of adults in DeFuniak Springs completed high school / ged.
23.0% of adults in DeFuniak Springs completed some college.
10.0% of adults in DeFuniak Springs completed associate's degree.
11.0% of adults in DeFuniak Springs completed bachelor's degree.
5.0% of adults in DeFuniak Springs completed master's degree.
1.0% of adults in DeFuniak Springs completed professional degree.
1.0% of adults in DeFuniak Springs completed doctorate degree.
| Education | DeFuniak Springs | FL | USA |
|---|---|---|---|
| < 9th Grade | 2.0% | 5.0% | 5.0% |
| 9-12th Grade | 14.0% | 6.0% | 6.0% |
| High School / GED | 33.0% | 27.0% | 26.0% |
| Some College | 23.0% | 19.0% | 19.0% |
| Associate's Degree | 10.0% | 10.0% | 9.0% |
| Bachelor's Degree | 11.0% | 21.0% | 21.0% |
| Master's Degree | 5.0% | 9.0% | 10.0% |
| Professional Degree | 1.0% | 2.0% | 2.0% |
| Doctorate Degree | 1.0% | 1.0% | 2.0% |
Household Income For DeFuniak Springs, Florida
6.1% of households in DeFuniak Springs earn Less than $10,000.
3.0% of households in DeFuniak Springs earn $10,000 to $14,999.
10.6% of households in DeFuniak Springs earn $15,000 to $24,999.
6.1% of households in DeFuniak Springs earn $25,000 to $34,999.
19.1% of households in DeFuniak Springs earn $35,000 to $49,999.
19.7% of households in DeFuniak Springs earn $50,000 to $74,999.
17.5% of households in DeFuniak Springs earn $75,000 to $99,999.
14.1% of households in DeFuniak Springs earn $100,000 to $149,999.
1.3% of households in DeFuniak Springs earn $150,000 to $199,999.
2.5% of households in DeFuniak Springs earn $200,000 or more.
| Income | DeFuniak Springs | FL | USA |
|---|---|---|---|
| Less than $10,000 | 6.1% | 5.1% | 4.9% |
| $10,000 to $14,999 | 3.0% | 3.4% | 3.6% |
| $15,000 to $24,999 | 10.6% | 7.0% | 6.6% |
| $25,000 to $34,999 | 6.1% | 7.7% | 6.8% |
| $35,000 to $49,999 | 19.1% | 11.6% | 10.4% |
| $50,000 to $74,999 | 19.7% | 17.3% | 15.7% |
| $75,000 to $99,999 | 17.5% | 13.1% | 12.7% |
| $100,000 to $149,999 | 14.1% | 16.8% | 17.4% |
| $150,000 to $199,999 | 1.3% | 8.0% | 9.3% |
| $200,000 or more | 2.5% | 10.1% | 12.6% |


