Largo SnackAbility
Overall SnackAbility
Crime in Largo summary. We use data from the FBI to determine the crime rates in Largo. Key points include:
There were 2,050 total crimes in Largo in the last reporting year.
The overall crime rate per 100,000 people in Largo is 2,485.2 / 100k people.
The violent crime rate per 100,000 people in Largo is 324.9 / 100k people.
The property crime rate per 100,000 people in Largo is 2,160.3 / 100k people.
Overall, crime in Largo is 17.27% above the national average.
Total Crimes
Above National Average
Crime In Largo Comparison Table
| Statistic | Count Raw |
Largo / 100k People |
Florida / 100k People |
National / 100k People |
|---|---|---|---|---|
| Total Crimes Per 100K | 2,050 | 2,485.2 | 1,687.5 | 2,119.2 |
| Violent Crime | 268 | 324.9 | 267.1 | 359.0 |
| Murder | 4 | 4.8 | 3.9 | 5.0 |
| Robbery | 30 | 36.4 | 38.2 | 61.0 |
| Aggravated Assault | 192 | 232.8 | 197.1 | 256.0 |
| Property Crime | 1,782 | 2,160.3 | 1,420.4 | 1,760.0 |
| Burglary | 99 | 120.0 | 152.5 | 229.0 |
| Larceny | 1,675 | 2,030.6 | 1,144.9 | 1,272.0 |
| Car Theft | 8 | 9.7 | 123.0 | 259.0 |
Source: FBI Uniform Crime Reporting (2024)
Cost of living in Largo summary. We use data on the cost of living to determine how expensive it is to live in Largo. Real estate prices drive most of the variance in cost of living around Florida. Key points include:
The cost of living in Largo is 101 with 100 being average.
The cost of living in Largo is 1.0x higher than the national average.
The median home value in Largo is $332,209.
The median income in Largo is $62,096.
Largo's Overall Cost Of Living
Higher Than The National Average
Cost Of Living In Largo Comparison Table
| Living Expense | Largo | Florida | National Average |
|---|---|---|---|
| Overall | 101 | 104 | 100 |
| Services | 100 | 101 | 100 |
| Groceries | 106 | 105 | 100 |
| Health | 88 | 99 | 100 |
| Housing | 106 | 104 | 100 |
| Transportation | 112 | 109 | 100 |
| Utilities | 106 | 105 | 100 |
Source: Cost of living index, normalized to US average = 100
Largo, FL Weather
The average high in Largo is 81.3° and the average low is 65.2°.
There are 69.0 days of precipitation each year.
Expect an average of 51.9 inches of precipitation each year with 0.0 inches of snow.
| Stat | Largo |
|---|---|
| Average Annual High | 81.3 |
| Average Annual Low | 65.2 |
| Annual Precipitation Days | 69.0 |
| Average Annual Precipitation | 51.9 |
| Average Annual Snowfall | 0.0 |
Average High
Days of Rain
Source: NOAA climate normals (30-year)
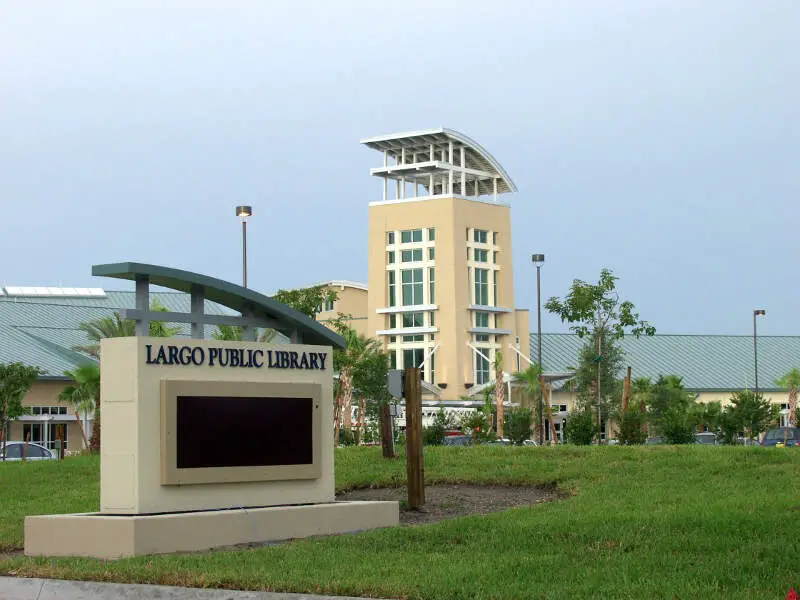
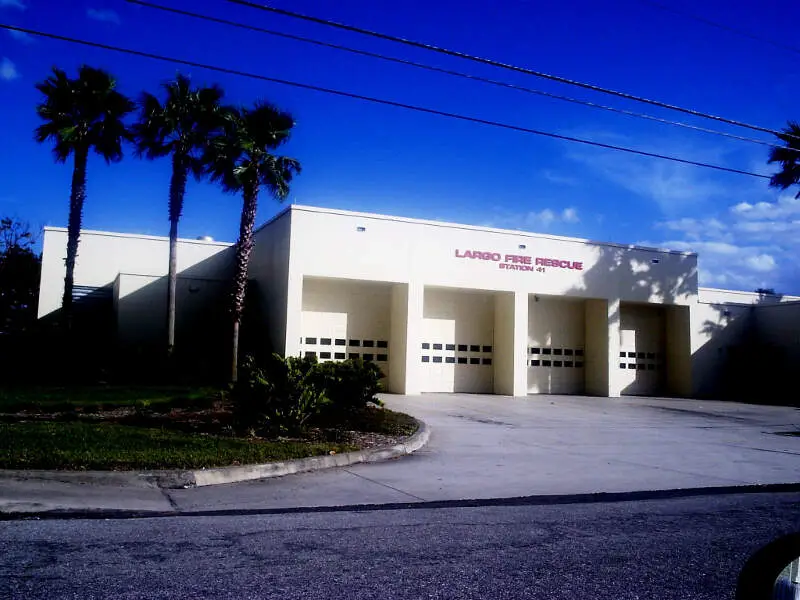
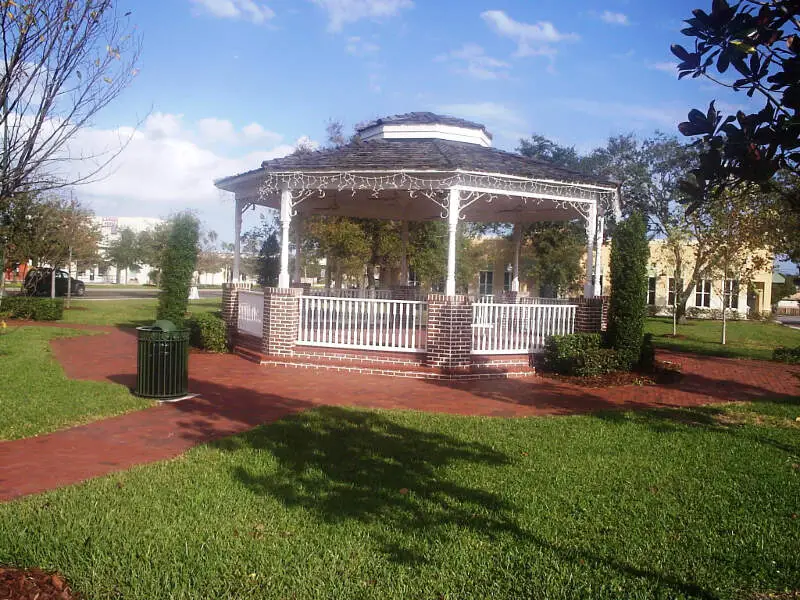
Largo, FL Photos


Rankings & Articles For Largo


Locations Around Largo
Map Of Largo, FL
Best Places Around Largo
Safety Harbor, FL
Population 17,033
Carrollwood, FL
Population 36,725
Pinellas Park, FL
Population 53,560
Palm Harbor, FL
Population 61,512
Citrus Park, FL
Population 28,804
Keystone, FL
Population 25,858
Oldsmar, FL
Population 14,904
Westchase, FL
Population 24,885
Lealman, FL
Population 20,567
East Lake, FL
Population 33,283
Largo Demographics And Statistics
Population over time in Largo
The current population in Largo is 82,617. The population has increased 7.1% from 2010.
| Year | Population | % Change |
|---|---|---|
| 2024 | 82,617 | 0.1% |
| 2023 | 82,506 | -0.0% |
| 2022 | 82,541 | 0.0% |
| 2021 | 82,505 | -2.6% |
| 2020 | 84,666 | 0.6% |
| 2019 | 84,130 | 1.1% |
| 2018 | 83,243 | 1.0% |
| 2017 | 82,433 | 2.2% |
| 2016 | 80,678 | 1.2% |
| 2015 | 79,737 | 1.7% |
| 2014 | 78,391 | 0.6% |
| 2013 | 77,898 | 0.5% |
| 2012 | 77,502 | 0.3% |
| 2011 | 77,279 | 0.2% |
| 2010 | 77,115 | - |
Race / Ethnicity in Largo
See the full breakdown
Largo is:
68.0% White with 56,202 White residents.
9.8% African American with 8,088 African American residents.
0.0% American Indian with 37 American Indian residents.
3.8% Asian with 3,141 Asian residents.
0.2% Hawaiian with 150 Hawaiian residents.
0.5% Other with 438 Other residents.
3.5% Two Or More with 2,904 Two Or More residents.
14.1% Hispanic with 11,657 Hispanic residents.
| Race | Largo | FL | USA |
|---|---|---|---|
| White | 68.0% | 50.4% | 57.4% |
| African American | 9.8% | 14.6% | 11.9% |
| American Indian | 0.0% | 0.1% | 0.5% |
| Asian | 3.8% | 2.9% | 5.9% |
| Hawaiian | 0.2% | 0.1% | 0.2% |
| Other | 0.5% | 0.7% | 0.6% |
| Two Or More | 3.5% | 3.8% | 4.3% |
| Hispanic | 14.1% | 27.4% | 19.3% |
Gender in Largo
See the full breakdown
Largo is 52.1% female with 43,078 female residents.
Largo is 47.9% male with 39,539 male residents.
| Gender | Largo | FL | USA |
|---|---|---|---|
| Female | 52.1% | 50.9% | 50.5% |
| Male | 47.9% | 49.1% | 49.5% |
Highest level of educational attainment in Largo for adults over 25
See the full breakdown
2.0% of adults in Largo completed < 9th grade.
5.0% of adults in Largo completed 9-12th grade.
32.0% of adults in Largo completed high school / ged.
23.0% of adults in Largo completed some college.
10.0% of adults in Largo completed associate's degree.
18.0% of adults in Largo completed bachelor's degree.
7.0% of adults in Largo completed master's degree.
2.0% of adults in Largo completed professional degree.
1.0% of adults in Largo completed doctorate degree.
| Education | Largo | FL | USA |
|---|---|---|---|
| < 9th Grade | 2.0% | 5.0% | 4.0% |
| 9-12th Grade | 5.0% | 6.0% | 6.0% |
| High School / GED | 32.0% | 27.0% | 26.0% |
| Some College | 23.0% | 19.0% | 19.0% |
| Associate's Degree | 10.0% | 10.0% | 9.0% |
| Bachelor's Degree | 18.0% | 21.0% | 22.0% |
| Master's Degree | 7.0% | 9.0% | 10.0% |
| Professional Degree | 2.0% | 2.0% | 2.0% |
| Doctorate Degree | 1.0% | 1.0% | 2.0% |
Household Income For Largo, Florida
See the full breakdown
6.2% of households in Largo earn Less than $10,000.
4.0% of households in Largo earn $10,000 to $14,999.
6.6% of households in Largo earn $15,000 to $24,999.
8.1% of households in Largo earn $25,000 to $34,999.
13.6% of households in Largo earn $35,000 to $49,999.
21.8% of households in Largo earn $50,000 to $74,999.
14.2% of households in Largo earn $75,000 to $99,999.
15.2% of households in Largo earn $100,000 to $149,999.
6.1% of households in Largo earn $150,000 to $199,999.
4.2% of households in Largo earn $200,000 or more.
| Income | Largo | FL | USA |
|---|---|---|---|
| Less than $10,000 | 6.2% | 5.1% | 5.0% |
| $10,000 to $14,999 | 4.0% | 3.3% | 3.4% |
| $15,000 to $24,999 | 6.6% | 6.6% | 6.3% |
| $25,000 to $34,999 | 8.1% | 7.3% | 6.6% |
| $35,000 to $49,999 | 13.6% | 11.1% | 10.1% |
| $50,000 to $74,999 | 21.8% | 16.8% | 15.5% |
| $75,000 to $99,999 | 14.2% | 13.1% | 12.6% |
| $100,000 to $149,999 | 15.2% | 17.2% | 17.5% |
| $150,000 to $199,999 | 6.1% | 8.4% | 9.6% |
| $200,000 or more | 4.2% | 11.0% | 13.4% |
Source: U.S. Census ACS 5-year estimates (2024)


