Melbourne SnackAbility
Overall SnackAbility
Crime in Melbourne summary. We use data from the FBI to determine the crime rates in Melbourne. Key points include:
There were 3,288 total crimes in Melbourne in the last reporting year.
The overall crime rate per 100,000 people in Melbourne is 3,923.3 / 100k people.
The violent crime rate per 100,000 people in Melbourne is 903.3 / 100k people.
The property crime rate per 100,000 people in Melbourne is 3,020.1 / 100k people.
Overall, crime in Melbourne is 85.13% above the national average.
Total Crimes
Above National Average
Crime In Melbourne Comparison Table
| Statistic | Count Raw |
Melbourne / 100k People |
Florida / 100k People |
National / 100k People |
|---|---|---|---|---|
| Total Crimes Per 100K | 3,288 | 3,923.3 | 1,687.5 | 2,119.2 |
| Violent Crime | 757 | 903.3 | 267.1 | 359.0 |
| Murder | 8 | 9.5 | 3.9 | 5.0 |
| Robbery | 86 | 102.6 | 38.2 | 61.0 |
| Aggravated Assault | 589 | 702.8 | 197.1 | 256.0 |
| Property Crime | 2,531 | 3,020.1 | 1,420.4 | 1,760.0 |
| Burglary | 393 | 468.9 | 152.5 | 229.0 |
| Larceny | 1,987 | 2,371.0 | 1,144.9 | 1,272.0 |
| Car Theft | 151 | 180.2 | 123.0 | 259.0 |
Source: FBI Uniform Crime Reporting (2024)
Cost of living in Melbourne summary. We use data on the cost of living to determine how expensive it is to live in Melbourne. Real estate prices drive most of the variance in cost of living around Florida. Key points include:
The cost of living in Melbourne is 106 with 100 being average.
The cost of living in Melbourne is 1.1x higher than the national average.
The median home value in Melbourne is $356,353.
The median income in Melbourne is $66,991.
Melbourne's Overall Cost Of Living
Higher Than The National Average
Cost Of Living In Melbourne Comparison Table
| Living Expense | Melbourne | Florida | National Average |
|---|---|---|---|
| Overall | 106 | 104 | 100 |
| Services | 106 | 101 | 100 |
| Groceries | 108 | 105 | 100 |
| Health | 106 | 99 | 100 |
| Housing | 104 | 104 | 100 |
| Transportation | 112 | 109 | 100 |
| Utilities | 104 | 105 | 100 |
Source: Cost of living index, normalized to US average = 100
Melbourne, FL Weather
The average high in Melbourne is 80.9° and the average low is 63.6°.
There are 73.5 days of precipitation each year.
Expect an average of 48.3 inches of precipitation each year with 0.0 inches of snow.
| Stat | Melbourne |
|---|---|
| Average Annual High | 80.9 |
| Average Annual Low | 63.6 |
| Annual Precipitation Days | 73.5 |
| Average Annual Precipitation | 48.3 |
| Average Annual Snowfall | 0.0 |
Average High
Days of Rain
Source: NOAA climate normals (30-year)
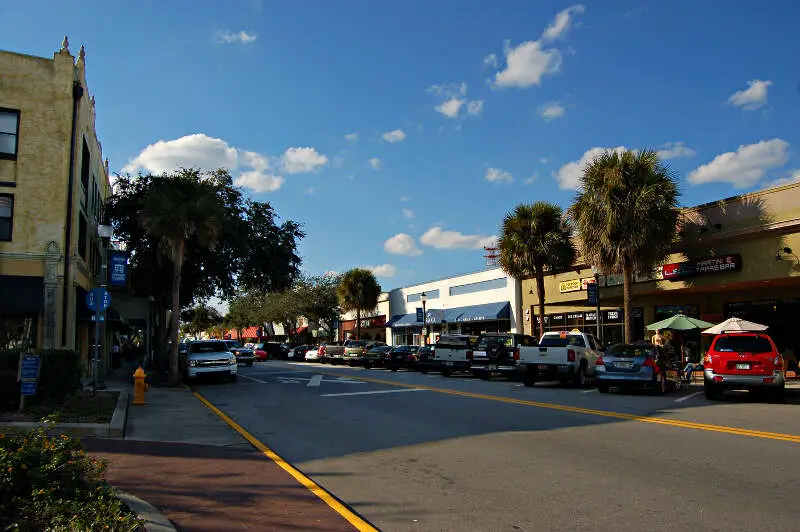
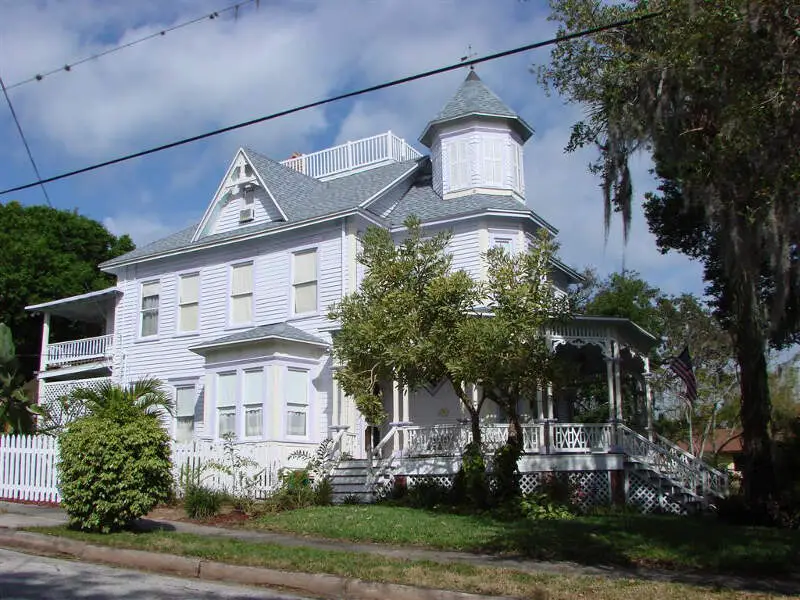
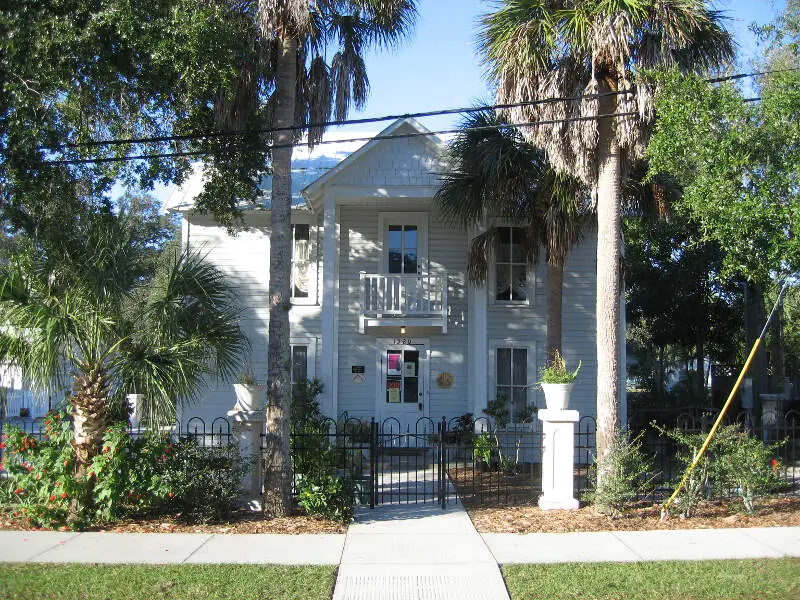
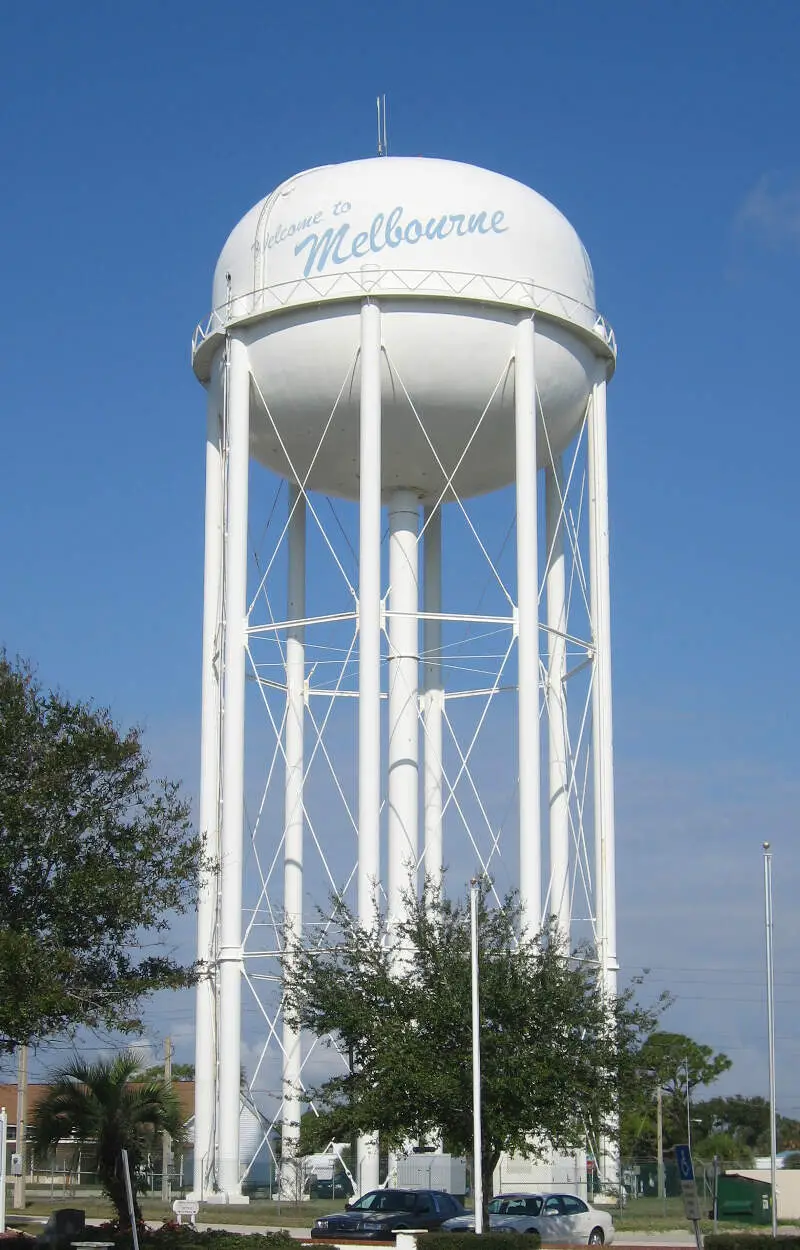
Melbourne, FL Photos


1 Reviews & Comments About Melbourne

melbourne and Brevard County overall by the most horrible and worst places to live in the United States
the police are in high population and are jerks
Rankings & Articles For Melbourne


Locations Around Melbourne
Map Of Melbourne, FL
Best Places Around Melbourne
Viera East, FL
Population 12,570
Satellite Beach, FL
Population 11,313
Rockledge, FL
Population 29,133
West Melbourne, FL
Population 28,795
Merritt Island, FL
Population 34,992
Palm Bay, FL
Population 130,132
Cocoa Beach, FL
Population 11,377
Cocoa, FL
Population 19,554
Melbourne Demographics And Statistics
Population over time in Melbourne
The current population in Melbourne is 86,576. The population has increased 12.8% from 2010.
| Year | Population | % Change |
|---|---|---|
| 2024 | 86,576 | 1.0% |
| 2023 | 85,718 | 0.9% |
| 2022 | 84,982 | 1.8% |
| 2021 | 83,500 | 1.5% |
| 2020 | 82,281 | 1.0% |
| 2019 | 81,468 | 1.0% |
| 2018 | 80,664 | 1.3% |
| 2017 | 79,640 | 0.9% |
| 2016 | 78,911 | 1.2% |
| 2015 | 78,012 | 1.0% |
| 2014 | 77,216 | 0.6% |
| 2013 | 76,768 | 0.2% |
| 2012 | 76,609 | 0.1% |
| 2011 | 76,538 | -0.2% |
| 2010 | 76,725 | - |
Race / Ethnicity in Melbourne
See the full breakdown
Melbourne is:
68.4% White with 59,228 White residents.
10.0% African American with 8,616 African American residents.
0.1% American Indian with 56 American Indian residents.
3.1% Asian with 2,648 Asian residents.
0.1% Hawaiian with 81 Hawaiian residents.
0.4% Other with 349 Other residents.
5.8% Two Or More with 5,012 Two Or More residents.
12.2% Hispanic with 10,586 Hispanic residents.
| Race | Melbourne | FL | USA |
|---|---|---|---|
| White | 68.4% | 50.4% | 57.4% |
| African American | 10.0% | 14.6% | 11.9% |
| American Indian | 0.1% | 0.1% | 0.5% |
| Asian | 3.1% | 2.9% | 5.9% |
| Hawaiian | 0.1% | 0.1% | 0.2% |
| Other | 0.4% | 0.7% | 0.6% |
| Two Or More | 5.8% | 3.8% | 4.3% |
| Hispanic | 12.2% | 27.4% | 19.3% |
Gender in Melbourne
See the full breakdown
Melbourne is 51.4% female with 44,466 female residents.
Melbourne is 48.6% male with 42,110 male residents.
| Gender | Melbourne | FL | USA |
|---|---|---|---|
| Female | 51.4% | 50.9% | 50.5% |
| Male | 48.6% | 49.1% | 49.5% |
Highest level of educational attainment in Melbourne for adults over 25
See the full breakdown
1.0% of adults in Melbourne completed < 9th grade.
5.0% of adults in Melbourne completed 9-12th grade.
25.0% of adults in Melbourne completed high school / ged.
22.0% of adults in Melbourne completed some college.
12.0% of adults in Melbourne completed associate's degree.
22.0% of adults in Melbourne completed bachelor's degree.
10.0% of adults in Melbourne completed master's degree.
2.0% of adults in Melbourne completed professional degree.
1.0% of adults in Melbourne completed doctorate degree.
| Education | Melbourne | FL | USA |
|---|---|---|---|
| < 9th Grade | 1.0% | 5.0% | 4.0% |
| 9-12th Grade | 5.0% | 6.0% | 6.0% |
| High School / GED | 25.0% | 27.0% | 26.0% |
| Some College | 22.0% | 19.0% | 19.0% |
| Associate's Degree | 12.0% | 10.0% | 9.0% |
| Bachelor's Degree | 22.0% | 21.0% | 22.0% |
| Master's Degree | 10.0% | 9.0% | 10.0% |
| Professional Degree | 2.0% | 2.0% | 2.0% |
| Doctorate Degree | 1.0% | 1.0% | 2.0% |
Household Income For Melbourne, Florida
See the full breakdown
5.7% of households in Melbourne earn Less than $10,000.
3.6% of households in Melbourne earn $10,000 to $14,999.
8.6% of households in Melbourne earn $15,000 to $24,999.
9.2% of households in Melbourne earn $25,000 to $34,999.
12.8% of households in Melbourne earn $35,000 to $49,999.
15.9% of households in Melbourne earn $50,000 to $74,999.
13.1% of households in Melbourne earn $75,000 to $99,999.
17.6% of households in Melbourne earn $100,000 to $149,999.
7.4% of households in Melbourne earn $150,000 to $199,999.
6.2% of households in Melbourne earn $200,000 or more.
| Income | Melbourne | FL | USA |
|---|---|---|---|
| Less than $10,000 | 5.7% | 5.1% | 5.0% |
| $10,000 to $14,999 | 3.6% | 3.3% | 3.4% |
| $15,000 to $24,999 | 8.6% | 6.6% | 6.3% |
| $25,000 to $34,999 | 9.2% | 7.3% | 6.6% |
| $35,000 to $49,999 | 12.8% | 11.1% | 10.1% |
| $50,000 to $74,999 | 15.9% | 16.8% | 15.5% |
| $75,000 to $99,999 | 13.1% | 13.1% | 12.6% |
| $100,000 to $149,999 | 17.6% | 17.2% | 17.5% |
| $150,000 to $199,999 | 7.4% | 8.4% | 9.6% |
| $200,000 or more | 6.2% | 11.0% | 13.4% |
Source: U.S. Census ACS 5-year estimates (2024)


