Merritt Island SnackAbility
Overall SnackAbility
Cost of living in Merritt Island summary. We use data on the cost of living to determine how expensive it is to live in Merritt Island. Real estate prices drive most of the variance in cost of living around Florida. Key points include:
The cost of living in Merritt Island is 116 with 100 being average.
The cost of living in Merritt Island is 1.2x higher than the national average.
The median home value in Merritt Island is $427,725.
The median income in Merritt Island is $94,012.
Merritt Island's Overall Cost Of Living
Higher Than The National Average
Cost Of Living In Merritt Island Comparison Table
| Living Expense | Merritt Island | Florida | National Average |
|---|---|---|---|
| Overall | 116 | 104 | 100 |
| Services | 102 | 101 | 100 |
| Groceries | 101 | 105 | 100 |
| Health | 145 | 99 | 100 |
| Housing | 105 | 104 | 100 |
| Transportation | 113 | 109 | 100 |
| Utilities | 105 | 105 | 100 |
Source: Cost of living index, normalized to US average = 100
Merritt Island, FL Weather
The average high in Merritt Island is 79.9° and the average low is 63.9°.
There are 73.5 days of precipitation each year.
Expect an average of 49.7 inches of precipitation each year with 0.0 inches of snow.
| Stat | Merritt Island |
|---|---|
| Average Annual High | 79.9 |
| Average Annual Low | 63.9 |
| Annual Precipitation Days | 73.5 |
| Average Annual Precipitation | 49.7 |
| Average Annual Snowfall | 0.0 |
Average High
Days of Rain
Source: NOAA climate normals (30-year)
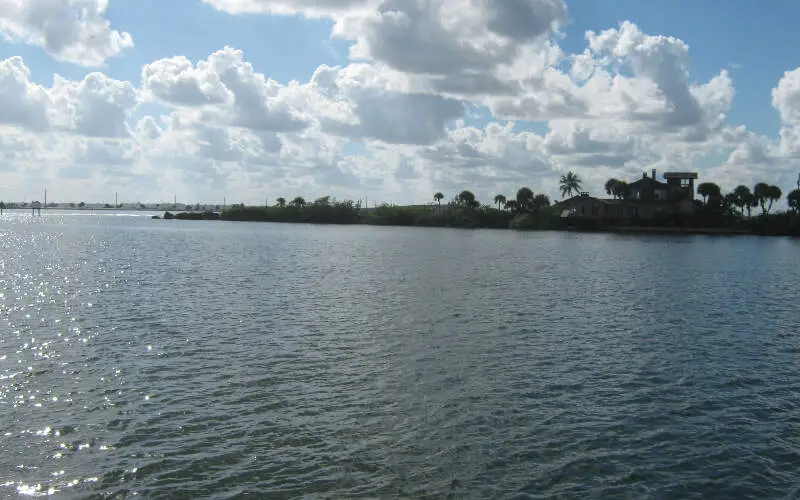
Merritt Island, FL Photos
Rankings & Articles For Merritt Island


Locations Around Merritt Island
Map Of Merritt Island, FL
Best Places Around Merritt Island
Viera East, FL
Population 12,570
Port St. John, FL
Population 25,120
Satellite Beach, FL
Population 11,313
Rockledge, FL
Population 29,133
West Melbourne, FL
Population 28,795
Melbourne, FL
Population 86,576
Melbourne, FL
Population 86,576
Cocoa Beach, FL
Population 11,377
Cocoa, FL
Population 19,554
Merritt Island Demographics And Statistics
Population over time in Merritt Island
The current population in Merritt Island is 34,992. The population has increased 2.3% from 2010.
| Year | Population | % Change |
|---|---|---|
| 2024 | 34,992 | 0.8% |
| 2023 | 34,718 | 1.2% |
| 2022 | 34,300 | 0.8% |
| 2021 | 34,013 | 0.1% |
| 2020 | 33,975 | -7.0% |
| 2019 | 36,532 | -0.7% |
| 2018 | 36,797 | 1.1% |
| 2017 | 36,380 | 1.3% |
| 2016 | 35,916 | 0.0% |
| 2015 | 35,900 | 2.4% |
| 2014 | 35,063 | 1.0% |
| 2013 | 34,731 | -0.1% |
| 2012 | 34,752 | 0.7% |
| 2011 | 34,519 | 0.9% |
| 2010 | 34,205 | - |
Race / Ethnicity in Merritt Island
See the full breakdown
Merritt Island is:
82.7% White with 28,943 White residents.
2.7% African American with 928 African American residents.
0.0% American Indian with 0 American Indian residents.
3.2% Asian with 1,105 Asian residents.
0.0% Hawaiian with 6 Hawaiian residents.
0.6% Other with 203 Other residents.
4.3% Two Or More with 1,514 Two Or More residents.
6.6% Hispanic with 2,293 Hispanic residents.
| Race | Merritt Island | FL | USA |
|---|---|---|---|
| White | 82.7% | 50.4% | 57.4% |
| African American | 2.7% | 14.6% | 11.9% |
| American Indian | 0.0% | 0.1% | 0.5% |
| Asian | 3.2% | 2.9% | 5.9% |
| Hawaiian | 0.0% | 0.1% | 0.2% |
| Other | 0.6% | 0.7% | 0.6% |
| Two Or More | 4.3% | 3.8% | 4.3% |
| Hispanic | 6.6% | 27.4% | 19.3% |
Gender in Merritt Island
See the full breakdown
Merritt Island is 49.9% female with 17,462 female residents.
Merritt Island is 50.1% male with 17,530 male residents.
| Gender | Merritt Island | FL | USA |
|---|---|---|---|
| Female | 49.9% | 50.9% | 50.5% |
| Male | 50.1% | 49.1% | 49.5% |
Highest level of educational attainment in Merritt Island for adults over 25
See the full breakdown
1.0% of adults in Merritt Island completed < 9th grade.
3.0% of adults in Merritt Island completed 9-12th grade.
21.0% of adults in Merritt Island completed high school / ged.
21.0% of adults in Merritt Island completed some college.
12.0% of adults in Merritt Island completed associate's degree.
24.0% of adults in Merritt Island completed bachelor's degree.
14.0% of adults in Merritt Island completed master's degree.
2.0% of adults in Merritt Island completed professional degree.
2.0% of adults in Merritt Island completed doctorate degree.
| Education | Merritt Island | FL | USA |
|---|---|---|---|
| < 9th Grade | 1.0% | 5.0% | 4.0% |
| 9-12th Grade | 3.0% | 6.0% | 6.0% |
| High School / GED | 21.0% | 27.0% | 26.0% |
| Some College | 21.0% | 19.0% | 19.0% |
| Associate's Degree | 12.0% | 10.0% | 9.0% |
| Bachelor's Degree | 24.0% | 21.0% | 22.0% |
| Master's Degree | 14.0% | 9.0% | 10.0% |
| Professional Degree | 2.0% | 2.0% | 2.0% |
| Doctorate Degree | 2.0% | 1.0% | 2.0% |
Household Income For Merritt Island, Florida
See the full breakdown
3.3% of households in Merritt Island earn Less than $10,000.
2.5% of households in Merritt Island earn $10,000 to $14,999.
5.0% of households in Merritt Island earn $15,000 to $24,999.
5.5% of households in Merritt Island earn $25,000 to $34,999.
7.9% of households in Merritt Island earn $35,000 to $49,999.
15.6% of households in Merritt Island earn $50,000 to $74,999.
12.1% of households in Merritt Island earn $75,000 to $99,999.
19.3% of households in Merritt Island earn $100,000 to $149,999.
11.2% of households in Merritt Island earn $150,000 to $199,999.
17.7% of households in Merritt Island earn $200,000 or more.
| Income | Merritt Island | FL | USA |
|---|---|---|---|
| Less than $10,000 | 3.3% | 5.1% | 5.0% |
| $10,000 to $14,999 | 2.5% | 3.3% | 3.4% |
| $15,000 to $24,999 | 5.0% | 6.6% | 6.3% |
| $25,000 to $34,999 | 5.5% | 7.3% | 6.6% |
| $35,000 to $49,999 | 7.9% | 11.1% | 10.1% |
| $50,000 to $74,999 | 15.6% | 16.8% | 15.5% |
| $75,000 to $99,999 | 12.1% | 13.1% | 12.6% |
| $100,000 to $149,999 | 19.3% | 17.2% | 17.5% |
| $150,000 to $199,999 | 11.2% | 8.4% | 9.6% |
| $200,000 or more | 17.7% | 11.0% | 13.4% |
Source: U.S. Census ACS 5-year estimates (2024)


