Naples SnackAbility
Overall SnackAbility
Crime in Naples summary. We use data from the FBI to determine the crime rates in Naples. Key points include:
There were 327 total crimes in Naples in the last reporting year.
The overall crime rate per 100,000 people in Naples is 1,662.6 / 100k people.
The violent crime rate per 100,000 people in Naples is 106.8 / 100k people.
The property crime rate per 100,000 people in Naples is 1,555.8 / 100k people.
Overall, crime in Naples is -21.55% below the national average.
Total Crimes
Below National Average
Crime In Naples Comparison Table
| Statistic | Count Raw |
Naples / 100k People |
Florida / 100k People |
National / 100k People |
|---|---|---|---|---|
| Total Crimes Per 100K | 327 | 1,662.6 | 1,687.5 | 2,119.2 |
| Violent Crime | 21 | 106.8 | 267.1 | 359.0 |
| Murder | 0 | 0.0 | 3.9 | 5.0 |
| Robbery | 1 | 5.1 | 38.2 | 61.0 |
| Aggravated Assault | 16 | 81.4 | 197.1 | 256.0 |
| Property Crime | 306 | 1,555.8 | 1,420.4 | 1,760.0 |
| Burglary | 22 | 111.9 | 152.5 | 229.0 |
| Larceny | 252 | 1,281.3 | 1,144.9 | 1,272.0 |
| Car Theft | 32 | 162.7 | 123.0 | 259.0 |
Source: FBI Uniform Crime Reporting (2024)
Cost of living in Naples summary. We use data on the cost of living to determine how expensive it is to live in Naples. Real estate prices drive most of the variance in cost of living around Florida. Key points include:
The cost of living in Naples is 202 with 100 being average.
The cost of living in Naples is 2.0x higher than the national average.
The median home value in Naples is $551,996.
The median income in Naples is $153,182.
Naples's Overall Cost Of Living
Higher Than The National Average
Cost Of Living In Naples Comparison Table
| Living Expense | Naples | Florida | National Average |
|---|---|---|---|
| Overall | 202 | 104 | 100 |
| Services | 102 | 101 | 100 |
| Groceries | 104 | 105 | 100 |
| Health | 433 | 99 | 100 |
| Housing | 106 | 104 | 100 |
| Transportation | 110 | 109 | 100 |
| Utilities | 106 | 105 | 100 |
Source: Cost of living index, normalized to US average = 100
Naples, FL Weather
The average high in Naples is 83.1° and the average low is 65.6°.
There are 80.6 days of precipitation each year.
Expect an average of 54.8 inches of precipitation each year with 0.0 inches of snow.
| Stat | Naples |
|---|---|
| Average Annual High | 83.1 |
| Average Annual Low | 65.6 |
| Annual Precipitation Days | 80.6 |
| Average Annual Precipitation | 54.8 |
| Average Annual Snowfall | 0.0 |
Average High
Days of Rain
Source: NOAA climate normals (30-year)
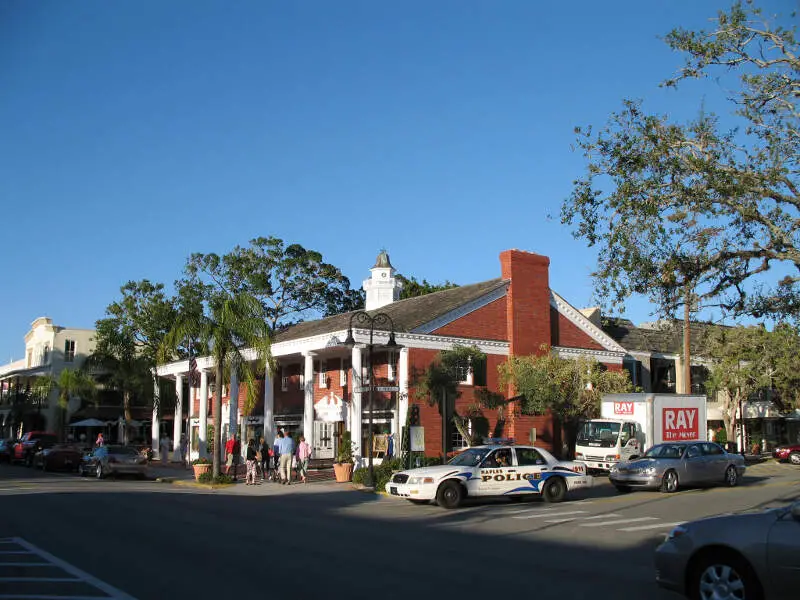
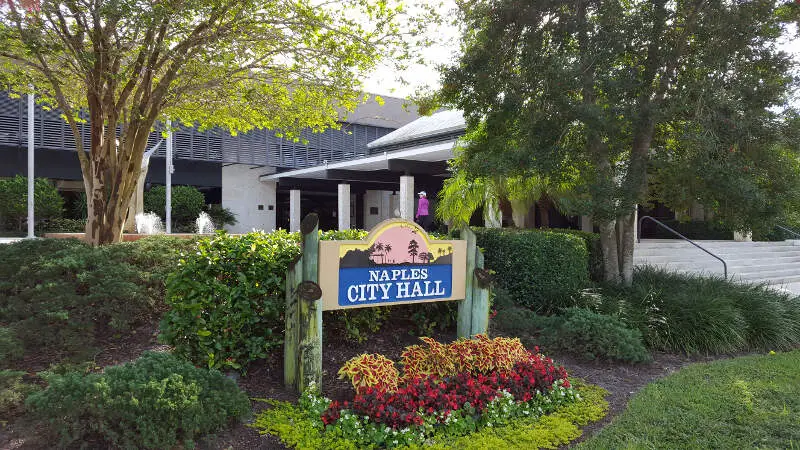
Naples, FL Photos


6 Reviews & Comments About Naples

I live in Naples and I can say without a doubt it's definitely boring as h**l. My daughter grew up here and fled to college up north to experience more of the world. I saw much of the world and lived all over the US when I was in the Army and buy is Naples quiet. I am glad it's safer than most cities but there's so little to do except go to the beach and zoo.
Shopping on 5th ave is too expensive and the mall gets old after a while. There are no nightclubs here and restaurants are filled with nothing but old couples and drunk widows at the bars in the restaurant.
NO CRIME, BEST SCHOOL SISTEM. Top rated schools in Naples
10
Mason Classical Academy
Naples, FL
Charter|K-12
10
Sea Gate Elementary School
Naples, FL
Public|PK-5
9
Laurel Oak Elementary School
Naples, FL
Public|PK-5
9
Gulfview Middle School
Naples, FL
Public|6-8
5TH AVENUE DOWN TOWN. rivers and backwaters. But how's your sun salutation, your tree stand and your downward dog, balanced on a paddleboard- It's the latest and most picturesque way to take a break from the gym and get out on the water--and it's surprisingly easy, says Taylor Masiero, owner of Sweetwater Paddlesports. Sweetwater is one
of several outfitters pairing up with YogaFit certified instructors all along the Gulfshore to host yoga classes and board rentals for SUPers seeking the next great thing. Get a lesson at sweetwaterpaddlesports.com, then find the next free yoga paddle meet-up near you at meetup.com/sup-yogafit.
2. Go Batty
Do you yearn for the exquisite silence of night paddling through a mysterious mangrove-fringed creek- Would you thrill to the sight of a thousand flying night mammals with 12-inch wingspans emerging from their hiding places before your very eyes- Then, for the experience of a lifetime, join up with a Florida master naturalist at Gaea Guides for one of their monthly two-hour bat tours on beautiful Judd Creek in North Fort Myers. The intimate tour also is available on the Imperial River in Bonita Springs.
3. Take Your Dog to Church
The Shell Factory is the place to get all spiritual with your pampered pooch and his/her friends. Doggy church is held every Sunday at the North Fort Myers attraction at 12:30 p.m. in the dog park. After the service, your dog can take a splash in the doggy fountain, run the agility course or snack with you at the Dog Bone Caf. Except for the Nature Park, with its free-roaming critters, and the Fishbone Caf, the entire historic and quirky Old Florida attraction is dog-friendly. shellfactory.com,
4. Drum at the Full Moon
"Be graced with the energies of the full moon we hope you will know Spirit in a way you haven't before." That's the compelling invitation to the monthly full moon drumming circles at Shangri- La Springs, the historic healing resort in the center of old Bonita Springs. You can bring your drum and join the circle, led by holistic practitioners Jeanie Williamson and Sayer Ji, or relax and listen beneath the great Mysore fig trees. It's free, every full moon from 6-9 p.m. shangrilaretreat.com,
I have lived in Naples FL for a long time and have seen our community grow from a fishing village to the wonderful city it now is. I have enjoyed the diversity that has become part of our every day life. As a teacher of religion I have come to respect the diversity of beliefs that have come to Naples. Most encouraging has been the acceptance non-Judeo-Christian belief systems.
I have lived in Naples FL for a long time and have seen our community grow from a fishing village to the wonderful city it now is. I have enjoyed the diversity that has become part of our every day life. As a teacher of religion I have come to respect the diversity of beliefs that have come to Naples. Most encouraging has been the acceptance non-Judeo-Christian belief systems.
The economy of Naples is based largely on tourism and was historically based on real estate development and agriculture. Due to its proximity to the Everglades and Ten Thousand Islands, Naples is also popular among ecotourists.
The economy of Naples is based largely on tourism and was historically based on real estate development and agriculture. Due to its proximity to the Everglades and Ten Thousand Islands, Naples is also popular among ecotourists.
There is little crime and the beaches are beautiful!
Great beaches, good restaurants, nice neighborhoods
Naples is the place to be if you enjoy red tide, blue/green algae, over-development and sitting in traffic. Come on down.
Favorite place is the zoo
Rankings & Articles For Naples


Locations Around Naples
Map Of Naples, FL
Best Places Around Naples
Marco Island, FL
Population 16,205
Golden Gate, FL
Population 29,234
San Carlos Park, FL
Population 19,159
Iona, FL
Population 13,631
Cypress Lake, FL
Population 13,032
Bonita Springs, FL
Population 55,904
Villas, FL
Population 13,644
Cape Coral, FL
Population 215,536
North Fort Myers, FL
Population 44,993
Naples Demographics And Statistics
Population over time in Naples
The current population in Naples is 19,704. The population has decreased 3.4% from 2010.
| Year | Population | % Change |
|---|---|---|
| 2024 | 19,704 | 1.5% |
| 2023 | 19,421 | 0.5% |
| 2022 | 19,315 | 0.7% |
| 2021 | 19,187 | -11.8% |
| 2020 | 21,750 | -0.3% |
| 2019 | 21,812 | 1.2% |
| 2018 | 21,564 | 1.3% |
| 2017 | 21,279 | 1.4% |
| 2016 | 20,980 | 1.8% |
| 2015 | 20,603 | 1.9% |
| 2014 | 20,214 | 1.1% |
| 2013 | 19,990 | 0.3% |
| 2012 | 19,933 | -0.8% |
| 2011 | 20,091 | -1.5% |
| 2010 | 20,405 | - |
Race / Ethnicity in Naples
See the full breakdown
Naples is:
88.9% White with 17,522 White residents.
3.3% African American with 658 African American residents.
0.1% American Indian with 18 American Indian residents.
0.8% Asian with 159 Asian residents.
0.0% Hawaiian with 0 Hawaiian residents.
0.3% Other with 51 Other residents.
1.8% Two Or More with 359 Two Or More residents.
4.8% Hispanic with 937 Hispanic residents.
| Race | Naples | FL | USA |
|---|---|---|---|
| White | 88.9% | 50.4% | 57.4% |
| African American | 3.3% | 14.6% | 11.9% |
| American Indian | 0.1% | 0.1% | 0.5% |
| Asian | 0.8% | 2.9% | 5.9% |
| Hawaiian | 0.0% | 0.1% | 0.2% |
| Other | 0.3% | 0.7% | 0.6% |
| Two Or More | 1.8% | 3.8% | 4.3% |
| Hispanic | 4.8% | 27.4% | 19.3% |
Gender in Naples
See the full breakdown
Naples is 53.2% female with 10,486 female residents.
Naples is 46.8% male with 9,218 male residents.
| Gender | Naples | FL | USA |
|---|---|---|---|
| Female | 53.2% | 50.9% | 50.5% |
| Male | 46.8% | 49.1% | 49.5% |
Highest level of educational attainment in Naples for adults over 25
See the full breakdown
1.0% of adults in Naples completed < 9th grade.
2.0% of adults in Naples completed 9-12th grade.
14.0% of adults in Naples completed high school / ged.
13.0% of adults in Naples completed some college.
6.0% of adults in Naples completed associate's degree.
37.0% of adults in Naples completed bachelor's degree.
16.0% of adults in Naples completed master's degree.
8.0% of adults in Naples completed professional degree.
3.0% of adults in Naples completed doctorate degree.
| Education | Naples | FL | USA |
|---|---|---|---|
| < 9th Grade | 1.0% | 5.0% | 4.0% |
| 9-12th Grade | 2.0% | 6.0% | 6.0% |
| High School / GED | 14.0% | 27.0% | 26.0% |
| Some College | 13.0% | 19.0% | 19.0% |
| Associate's Degree | 6.0% | 10.0% | 9.0% |
| Bachelor's Degree | 37.0% | 21.0% | 22.0% |
| Master's Degree | 16.0% | 9.0% | 10.0% |
| Professional Degree | 8.0% | 2.0% | 2.0% |
| Doctorate Degree | 3.0% | 1.0% | 2.0% |
Household Income For Naples, Florida
See the full breakdown
4.6% of households in Naples earn Less than $10,000.
1.3% of households in Naples earn $10,000 to $14,999.
5.0% of households in Naples earn $15,000 to $24,999.
2.7% of households in Naples earn $25,000 to $34,999.
8.8% of households in Naples earn $35,000 to $49,999.
8.9% of households in Naples earn $50,000 to $74,999.
7.0% of households in Naples earn $75,000 to $99,999.
11.3% of households in Naples earn $100,000 to $149,999.
10.7% of households in Naples earn $150,000 to $199,999.
39.8% of households in Naples earn $200,000 or more.
| Income | Naples | FL | USA |
|---|---|---|---|
| Less than $10,000 | 4.6% | 5.1% | 5.0% |
| $10,000 to $14,999 | 1.3% | 3.3% | 3.4% |
| $15,000 to $24,999 | 5.0% | 6.6% | 6.3% |
| $25,000 to $34,999 | 2.7% | 7.3% | 6.6% |
| $35,000 to $49,999 | 8.8% | 11.1% | 10.1% |
| $50,000 to $74,999 | 8.9% | 16.8% | 15.5% |
| $75,000 to $99,999 | 7.0% | 13.1% | 12.6% |
| $100,000 to $149,999 | 11.3% | 17.2% | 17.5% |
| $150,000 to $199,999 | 10.7% | 8.4% | 9.6% |
| $200,000 or more | 39.8% | 11.0% | 13.4% |
Source: U.S. Census ACS 5-year estimates (2024)


