New Smyrna Beach SnackAbility
Overall SnackAbility
Crime in New Smyrna Beach summary. We use data from the FBI to determine the crime rates in New Smyrna Beach. Key points include:
There were 322 total crimes in New Smyrna Beach in the last reporting year.
The overall crime rate per 100,000 people in New Smyrna Beach is 1,011.3 / 100k people.
The violent crime rate per 100,000 people in New Smyrna Beach is 166.5 / 100k people.
The property crime rate per 100,000 people in New Smyrna Beach is 844.9 / 100k people.
Overall, crime in New Smyrna Beach is -52.28% below the national average.
Total Crimes
Below National Average
Crime In New Smyrna Beach Comparison Table
| Statistic | Count Raw |
New Smyrna Beach / 100k People |
Florida / 100k People |
National / 100k People |
|---|---|---|---|---|
| Total Crimes Per 100K | 322 | 1,011.3 | 1,687.5 | 2,119.2 |
| Violent Crime | 53 | 166.5 | 267.1 | 359.0 |
| Murder | 0 | 0.0 | 3.9 | 5.0 |
| Robbery | 6 | 18.8 | 38.2 | 61.0 |
| Aggravated Assault | 47 | 147.6 | 197.1 | 256.0 |
| Property Crime | 269 | 844.9 | 1,420.4 | 1,760.0 |
| Burglary | 39 | 122.5 | 152.5 | 229.0 |
| Larceny | 202 | 634.4 | 1,144.9 | 1,272.0 |
| Car Theft | 28 | 87.9 | 123.0 | 259.0 |
Source: FBI Uniform Crime Reporting (2024)
Cost of living in New Smyrna Beach summary. We use data on the cost of living to determine how expensive it is to live in New Smyrna Beach. Real estate prices drive most of the variance in cost of living around Florida. Key points include:
The cost of living in New Smyrna Beach is 118 with 100 being average.
The cost of living in New Smyrna Beach is 1.2x higher than the national average.
The median home value in New Smyrna Beach is $448,437.
The median income in New Smyrna Beach is $83,865.
New Smyrna Beach's Overall Cost Of Living
Higher Than The National Average
Cost Of Living In New Smyrna Beach Comparison Table
| Living Expense | New Smyrna Beach | Florida | National Average |
|---|---|---|---|
| Overall | 118 | 104 | 100 |
| Services | 100 | 101 | 100 |
| Groceries | 109 | 105 | 100 |
| Health | 148 | 99 | 100 |
| Housing | 103 | 104 | 100 |
| Transportation | 105 | 109 | 100 |
| Utilities | 101 | 105 | 100 |
Source: Cost of living index, normalized to US average = 100
New Smyrna Beach, FL Weather
The average high in New Smyrna Beach is 79.9° and the average low is 62.2°.
There are 72.0 days of precipitation each year.
Expect an average of 51.0 inches of precipitation each year with 0.0 inches of snow.
| Stat | New Smyrna Beach |
|---|---|
| Average Annual High | 79.9 |
| Average Annual Low | 62.2 |
| Annual Precipitation Days | 72.0 |
| Average Annual Precipitation | 51.0 |
| Average Annual Snowfall | 0.0 |
Average High
Days of Rain
Source: NOAA climate normals (30-year)
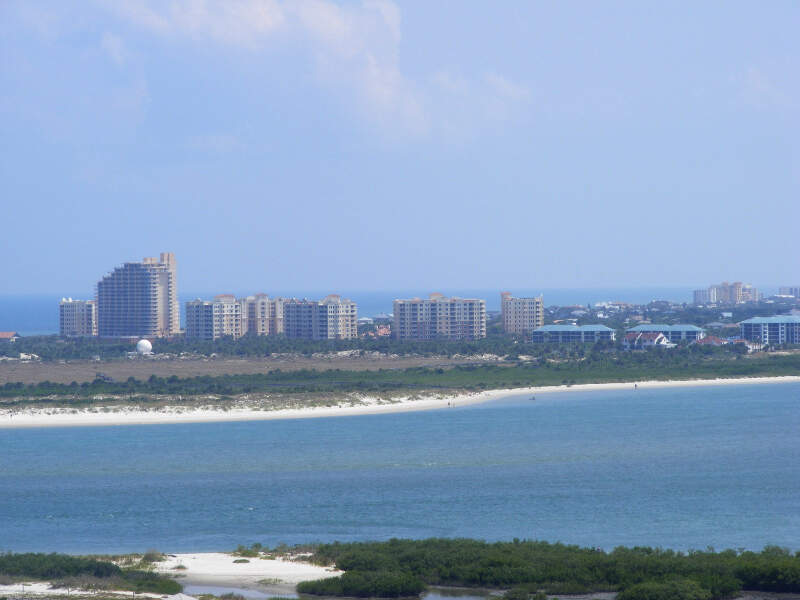
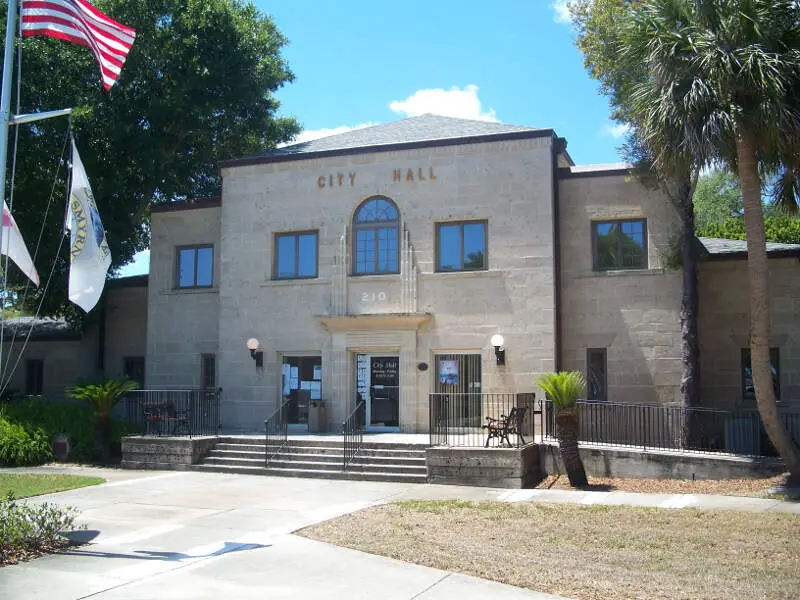
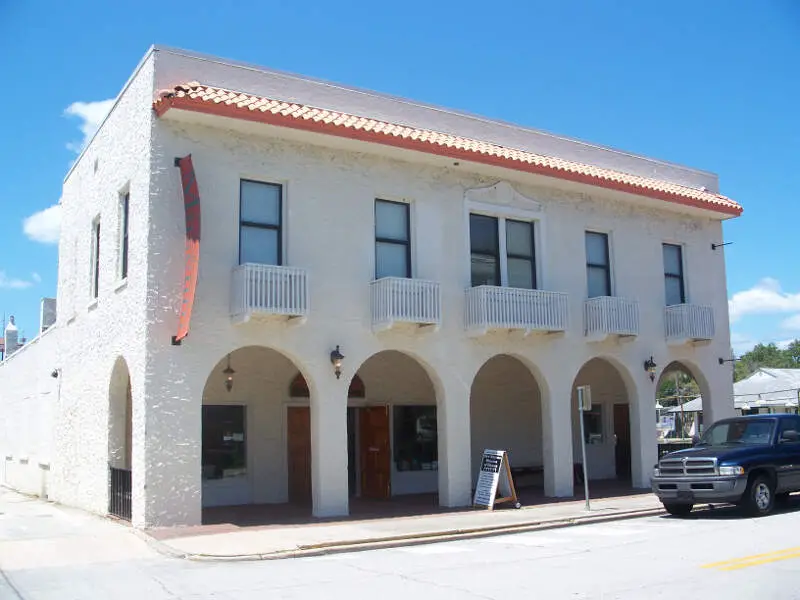
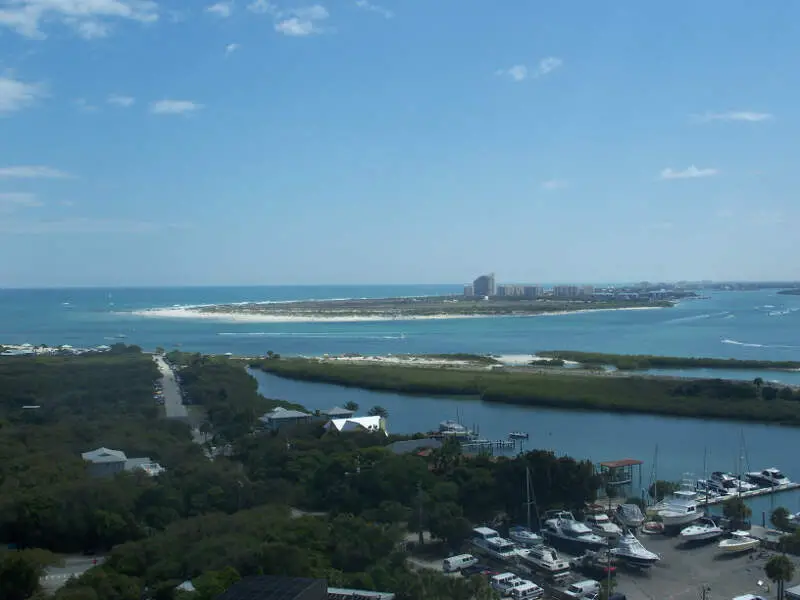
New Smyrna Beach, FL Photos


2 Reviews & Comments About New Smyrna Beach

New Smyrna Beach is a small beach town. The crime rate isn't too bad in my area. I think it is a cute little town. Quaint but beginning to grow.
There are a lot of nice restaurants. We need more places to shop, which we are starting to get.
Awesome place to live. Have lived here for 23 years, grew up here.
Great beach. Lots of tourists coming from Orlando for the beach.
Rankings & Articles For New Smyrna Beach


Locations Around New Smyrna Beach
Map Of New Smyrna Beach, FL
Best Places Around New Smyrna Beach
Port Orange, FL
Population 64,767
Deltona, FL
Population 97,334
Edgewater, FL
Population 23,627
South Daytona, FL
Population 13,543
Holly Hill, FL
Population 13,084
Daytona Beach, FL
Population 78,992
New Smyrna Beach Demographics And Statistics
Population over time in New Smyrna Beach
The current population in New Smyrna Beach is 31,974. The population has increased 41.9% from 2010.
| Year | Population | % Change |
|---|---|---|
| 2024 | 31,974 | 2.4% |
| 2023 | 31,212 | 2.5% |
| 2022 | 30,449 | 2.6% |
| 2021 | 29,674 | 9.1% |
| 2020 | 27,207 | 2.8% |
| 2019 | 26,457 | 2.7% |
| 2018 | 25,770 | 2.7% |
| 2017 | 25,103 | 2.2% |
| 2016 | 24,574 | 5.2% |
| 2015 | 23,356 | 1.6% |
| 2014 | 22,993 | 1.0% |
| 2013 | 22,775 | 0.5% |
| 2012 | 22,658 | 0.6% |
| 2011 | 22,527 | -0.1% |
| 2010 | 22,540 | - |
Race / Ethnicity in New Smyrna Beach
See the full breakdown
New Smyrna Beach is:
83.8% White with 26,788 White residents.
4.3% African American with 1,370 African American residents.
0.0% American Indian with 5 American Indian residents.
1.3% Asian with 405 Asian residents.
0.0% Hawaiian with 0 Hawaiian residents.
0.4% Other with 114 Other residents.
2.5% Two Or More with 802 Two Or More residents.
7.8% Hispanic with 2,490 Hispanic residents.
| Race | New Smyrna Beach | FL | USA |
|---|---|---|---|
| White | 83.8% | 50.4% | 57.4% |
| African American | 4.3% | 14.6% | 11.9% |
| American Indian | 0.0% | 0.1% | 0.5% |
| Asian | 1.3% | 2.9% | 5.9% |
| Hawaiian | 0.0% | 0.1% | 0.2% |
| Other | 0.4% | 0.7% | 0.6% |
| Two Or More | 2.5% | 3.8% | 4.3% |
| Hispanic | 7.8% | 27.4% | 19.3% |
Gender in New Smyrna Beach
See the full breakdown
New Smyrna Beach is 51.1% female with 16,345 female residents.
New Smyrna Beach is 48.9% male with 15,628 male residents.
| Gender | New Smyrna Beach | FL | USA |
|---|---|---|---|
| Female | 51.1% | 50.9% | 50.5% |
| Male | 48.9% | 49.1% | 49.5% |
Highest level of educational attainment in New Smyrna Beach for adults over 25
See the full breakdown
3.0% of adults in New Smyrna Beach completed < 9th grade.
4.0% of adults in New Smyrna Beach completed 9-12th grade.
25.0% of adults in New Smyrna Beach completed high school / ged.
19.0% of adults in New Smyrna Beach completed some college.
10.0% of adults in New Smyrna Beach completed associate's degree.
24.0% of adults in New Smyrna Beach completed bachelor's degree.
11.0% of adults in New Smyrna Beach completed master's degree.
3.0% of adults in New Smyrna Beach completed professional degree.
1.0% of adults in New Smyrna Beach completed doctorate degree.
| Education | New Smyrna Beach | FL | USA |
|---|---|---|---|
| < 9th Grade | 3.0% | 5.0% | 4.0% |
| 9-12th Grade | 4.0% | 6.0% | 6.0% |
| High School / GED | 25.0% | 27.0% | 26.0% |
| Some College | 19.0% | 19.0% | 19.0% |
| Associate's Degree | 10.0% | 10.0% | 9.0% |
| Bachelor's Degree | 24.0% | 21.0% | 22.0% |
| Master's Degree | 11.0% | 9.0% | 10.0% |
| Professional Degree | 3.0% | 2.0% | 2.0% |
| Doctorate Degree | 1.0% | 1.0% | 2.0% |
Household Income For New Smyrna Beach, Florida
See the full breakdown
4.0% of households in New Smyrna Beach earn Less than $10,000.
2.6% of households in New Smyrna Beach earn $10,000 to $14,999.
6.4% of households in New Smyrna Beach earn $15,000 to $24,999.
6.4% of households in New Smyrna Beach earn $25,000 to $34,999.
8.9% of households in New Smyrna Beach earn $35,000 to $49,999.
15.1% of households in New Smyrna Beach earn $50,000 to $74,999.
16.6% of households in New Smyrna Beach earn $75,000 to $99,999.
19.9% of households in New Smyrna Beach earn $100,000 to $149,999.
9.8% of households in New Smyrna Beach earn $150,000 to $199,999.
10.2% of households in New Smyrna Beach earn $200,000 or more.
| Income | New Smyrna Beach | FL | USA |
|---|---|---|---|
| Less than $10,000 | 4.0% | 5.1% | 5.0% |
| $10,000 to $14,999 | 2.6% | 3.3% | 3.4% |
| $15,000 to $24,999 | 6.4% | 6.6% | 6.3% |
| $25,000 to $34,999 | 6.4% | 7.3% | 6.6% |
| $35,000 to $49,999 | 8.9% | 11.1% | 10.1% |
| $50,000 to $74,999 | 15.1% | 16.8% | 15.5% |
| $75,000 to $99,999 | 16.6% | 13.1% | 12.6% |
| $100,000 to $149,999 | 19.9% | 17.2% | 17.5% |
| $150,000 to $199,999 | 9.8% | 8.4% | 9.6% |
| $200,000 or more | 10.2% | 11.0% | 13.4% |
Source: U.S. Census ACS 5-year estimates (2024)


