Panama City Beach SnackAbility
Overall SnackAbility
Crime in Panama City Beach summary. We use data from the FBI to determine the crime rates in Panama City Beach. Key points include:
There were 887 total crimes in Panama City Beach in the last reporting year.
The overall crime rate per 100,000 people in Panama City Beach is 6,982.6 / 100k people.
The violent crime rate per 100,000 people in Panama City Beach is 1,031.3 / 100k people.
The property crime rate per 100,000 people in Panama City Beach is 5,951.4 / 100k people.
Overall, crime in Panama City Beach is 229.49% above the national average.
Total Crimes
Above National Average
Crime In Panama City Beach Comparison Table
| Statistic | Count Raw |
Panama City Beach / 100k People |
Florida / 100k People |
National / 100k People |
|---|---|---|---|---|
| Total Crimes Per 100K | 887 | 6,982.6 | 1,687.5 | 2,119.2 |
| Violent Crime | 131 | 1,031.3 | 267.1 | 359.0 |
| Murder | 2 | 15.7 | 3.9 | 5.0 |
| Robbery | 10 | 78.7 | 38.2 | 61.0 |
| Aggravated Assault | 107 | 842.3 | 197.1 | 256.0 |
| Property Crime | 756 | 5,951.4 | 1,420.4 | 1,760.0 |
| Burglary | 56 | 440.8 | 152.5 | 229.0 |
| Larceny | 689 | 5,423.9 | 1,144.9 | 1,272.0 |
| Car Theft | 11 | 86.6 | 123.0 | 259.0 |
Source: FBI Uniform Crime Reporting (2024)
Cost of living in Panama City Beach summary. We use data on the cost of living to determine how expensive it is to live in Panama City Beach. Real estate prices drive most of the variance in cost of living around Florida. Key points include:
The cost of living in Panama City Beach is 114 with 100 being average.
The cost of living in Panama City Beach is 1.1x higher than the national average.
The median home value in Panama City Beach is $412,495.
The median income in Panama City Beach is $80,941.
Panama City Beach's Overall Cost Of Living
Higher Than The National Average
Cost Of Living In Panama City Beach Comparison Table
| Living Expense | Panama City Beach | Florida | National Average |
|---|---|---|---|
| Overall | 114 | 104 | 100 |
| Services | 99 | 101 | 100 |
| Groceries | 105 | 105 | 100 |
| Health | 146 | 99 | 100 |
| Housing | 102 | 104 | 100 |
| Transportation | 105 | 109 | 100 |
| Utilities | 105 | 105 | 100 |
Source: Cost of living index, normalized to US average = 100
Panama City Beach, FL Weather
The average high in Panama City Beach is 77.5° and the average low is 59.2°.
There are 78.7 days of precipitation each year.
Expect an average of 61.3 inches of precipitation each year with 0.0 inches of snow.
| Stat | Panama City Beach |
|---|---|
| Average Annual High | 77.5 |
| Average Annual Low | 59.2 |
| Annual Precipitation Days | 78.7 |
| Average Annual Precipitation | 61.3 |
| Average Annual Snowfall | 0.0 |
Average High
Days of Rain
Source: NOAA climate normals (30-year)
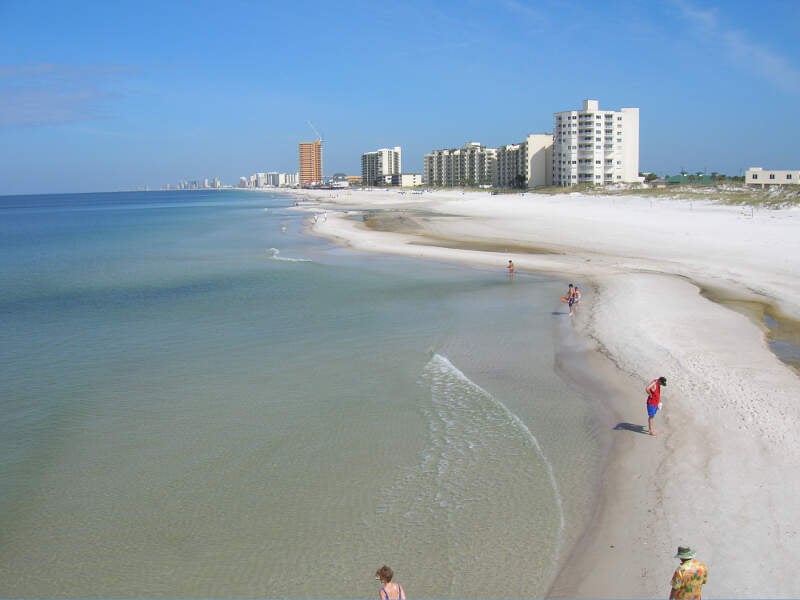
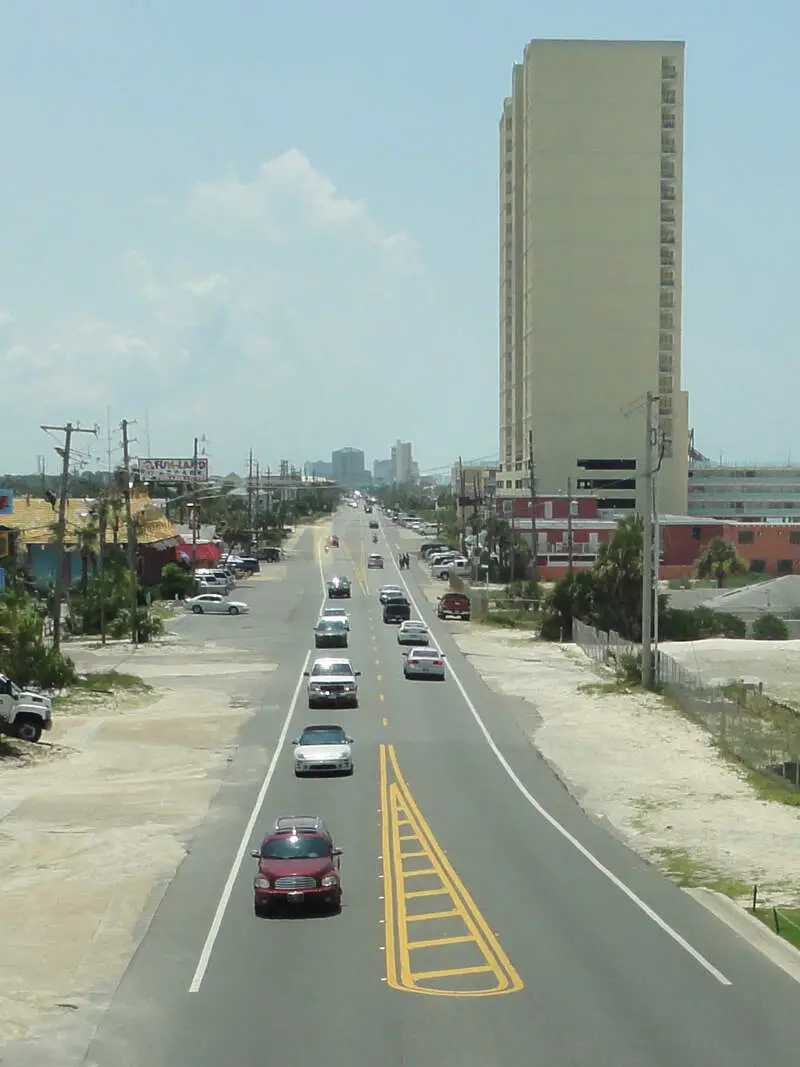
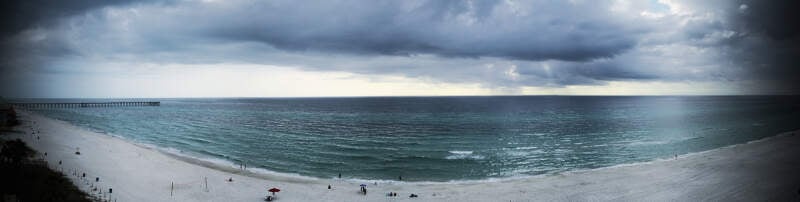
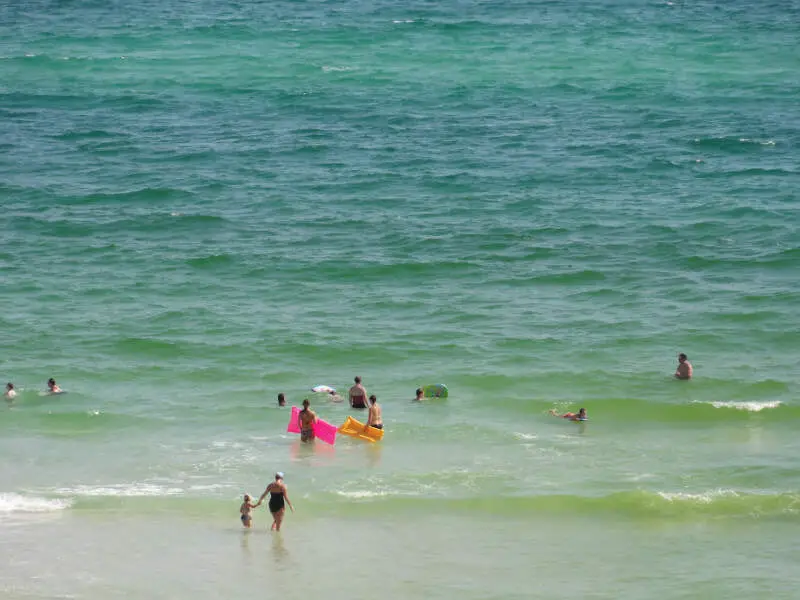
Panama City Beach, FL Photos

2 Reviews & Comments About Panama City Beach

I've grown up in Panama City for the majority of my life and I ended up living on Panama City Beach when I moved out as a teen. It's somewhere I call home and that I've enjoyed. Panama City is small I would say but not so small. When I go to bigger cities like San Antonio I was pretty overwhelmed but I know one thing you wouldn't really have to worry about is traffic like compared to San Antonio! We didn't have like huge amusement parks or museums to go to but we had a beach that was very nice! But it still had stuff to do for family and kids. There was crime there I mean where isn't there crime but I felt like it wasn't a lot especially since drinking was banned on the beach for the month of March which made college kids stay away but other than that PC will always home for me.
The beach is probably the best place to be that stands out and if you love seafood there's so many seafood restaurants to choose from! If you don't like being around a lot of people when you go on vacation then I guess avoid all the tourist that come down during summertime.
I love Panama City Beach. There is so much to do there! The beach is pristine with the white sand, and there is lots of fun to be had off of the beach as well. There are numerous restaurants and night life. There is an outlet mall and many stores and shops throughout town filled with goodies. Especially if you have a family, there are tons of fun activities such a mini golf, go kart riding, mazes, arcades, amusement rides, and so much more. Panama City Beach is an exciting place to be!
Hammerhead Freds was a great place to eat! The beach itself was wonderful and a great way to spend the day!
Rankings & Articles For Panama City Beach


Locations Around Panama City Beach
Map Of Panama City Beach, FL
Best Places Around Panama City Beach
Panama City Beach Demographics And Statistics
Population over time in Panama City Beach
The current population in Panama City Beach is 18,971. The population has increased 66.9% from 2010.
| Year | Population | % Change |
|---|---|---|
| 2024 | 18,971 | 2.6% |
| 2023 | 18,493 | 1.2% |
| 2022 | 18,281 | 2.2% |
| 2021 | 17,882 | 40.3% |
| 2020 | 12,747 | -0.0% |
| 2019 | 12,751 | 0.5% |
| 2018 | 12,683 | 1.8% |
| 2017 | 12,461 | 1.0% |
| 2016 | 12,333 | 2.0% |
| 2015 | 12,092 | 1.8% |
| 2014 | 11,884 | 1.1% |
| 2013 | 11,750 | 1.1% |
| 2012 | 11,623 | -0.2% |
| 2011 | 11,641 | 2.4% |
| 2010 | 11,364 | - |
Race / Ethnicity in Panama City Beach
See the full breakdown
Panama City Beach is:
77.1% White with 14,635 White residents.
5.4% African American with 1,032 African American residents.
0.4% American Indian with 73 American Indian residents.
1.8% Asian with 332 Asian residents.
0.0% Hawaiian with 0 Hawaiian residents.
0.5% Other with 86 Other residents.
4.7% Two Or More with 890 Two Or More residents.
10.1% Hispanic with 1,923 Hispanic residents.
| Race | Panama City Beach | FL | USA |
|---|---|---|---|
| White | 77.1% | 50.4% | 57.4% |
| African American | 5.4% | 14.6% | 11.9% |
| American Indian | 0.4% | 0.1% | 0.5% |
| Asian | 1.8% | 2.9% | 5.9% |
| Hawaiian | 0.0% | 0.1% | 0.2% |
| Other | 0.5% | 0.7% | 0.6% |
| Two Or More | 4.7% | 3.8% | 4.3% |
| Hispanic | 10.1% | 27.4% | 19.3% |
Gender in Panama City Beach
See the full breakdown
Panama City Beach is 49.6% female with 9,419 female residents.
Panama City Beach is 50.4% male with 9,552 male residents.
| Gender | Panama City Beach | FL | USA |
|---|---|---|---|
| Female | 49.6% | 50.9% | 50.5% |
| Male | 50.4% | 49.1% | 49.5% |
Highest level of educational attainment in Panama City Beach for adults over 25
See the full breakdown
2.0% of adults in Panama City Beach completed < 9th grade.
3.0% of adults in Panama City Beach completed 9-12th grade.
21.0% of adults in Panama City Beach completed high school / ged.
24.0% of adults in Panama City Beach completed some college.
12.0% of adults in Panama City Beach completed associate's degree.
24.0% of adults in Panama City Beach completed bachelor's degree.
11.0% of adults in Panama City Beach completed master's degree.
2.0% of adults in Panama City Beach completed professional degree.
1.0% of adults in Panama City Beach completed doctorate degree.
| Education | Panama City Beach | FL | USA |
|---|---|---|---|
| < 9th Grade | 2.0% | 5.0% | 4.0% |
| 9-12th Grade | 3.0% | 6.0% | 6.0% |
| High School / GED | 21.0% | 27.0% | 26.0% |
| Some College | 24.0% | 19.0% | 19.0% |
| Associate's Degree | 12.0% | 10.0% | 9.0% |
| Bachelor's Degree | 24.0% | 21.0% | 22.0% |
| Master's Degree | 11.0% | 9.0% | 10.0% |
| Professional Degree | 2.0% | 2.0% | 2.0% |
| Doctorate Degree | 1.0% | 1.0% | 2.0% |
Household Income For Panama City Beach, Florida
See the full breakdown
5.9% of households in Panama City Beach earn Less than $10,000.
1.3% of households in Panama City Beach earn $10,000 to $14,999.
5.8% of households in Panama City Beach earn $15,000 to $24,999.
4.8% of households in Panama City Beach earn $25,000 to $34,999.
10.8% of households in Panama City Beach earn $35,000 to $49,999.
14.5% of households in Panama City Beach earn $50,000 to $74,999.
17.2% of households in Panama City Beach earn $75,000 to $99,999.
16.4% of households in Panama City Beach earn $100,000 to $149,999.
10.6% of households in Panama City Beach earn $150,000 to $199,999.
12.7% of households in Panama City Beach earn $200,000 or more.
| Income | Panama City Beach | FL | USA |
|---|---|---|---|
| Less than $10,000 | 5.9% | 5.1% | 5.0% |
| $10,000 to $14,999 | 1.3% | 3.3% | 3.4% |
| $15,000 to $24,999 | 5.8% | 6.6% | 6.3% |
| $25,000 to $34,999 | 4.8% | 7.3% | 6.6% |
| $35,000 to $49,999 | 10.8% | 11.1% | 10.1% |
| $50,000 to $74,999 | 14.5% | 16.8% | 15.5% |
| $75,000 to $99,999 | 17.2% | 13.1% | 12.6% |
| $100,000 to $149,999 | 16.4% | 17.2% | 17.5% |
| $150,000 to $199,999 | 10.6% | 8.4% | 9.6% |
| $200,000 or more | 12.7% | 11.0% | 13.4% |
Source: U.S. Census ACS 5-year estimates (2024)


