Weston SnackAbility
Overall SnackAbility
Crime in Weston summary. We use data from the FBI to determine the crime rates in Weston. Key points include:
There were 343 total crimes in Weston in the last reporting year.
The overall crime rate per 100,000 people in Weston is 477.6 / 100k people.
The violent crime rate per 100,000 people in Weston is 50.1 / 100k people.
The property crime rate per 100,000 people in Weston is 427.5 / 100k people.
Overall, crime in Weston is -77.46% below the national average.
Total Crimes
Below National Average
Crime In Weston Comparison Table
| Statistic | Count Raw |
Weston / 100k People |
Florida / 100k People |
National / 100k People |
|---|---|---|---|---|
| Total Crimes Per 100K | 343 | 477.6 | 1,687.5 | 2,119.2 |
| Violent Crime | 36 | 50.1 | 267.1 | 359.0 |
| Murder | 1 | 1.4 | 3.9 | 5.0 |
| Robbery | 5 | 7.0 | 38.2 | 61.0 |
| Aggravated Assault | 20 | 27.8 | 197.1 | 256.0 |
| Property Crime | 307 | 427.5 | 1,420.4 | 1,760.0 |
| Burglary | 30 | 41.8 | 152.5 | 229.0 |
| Larceny | 226 | 314.7 | 1,144.9 | 1,272.0 |
| Car Theft | 51 | 71.0 | 123.0 | 259.0 |
Source: FBI Uniform Crime Reporting (2024)
Cost of living in Weston summary. We use data on the cost of living to determine how expensive it is to live in Weston. Real estate prices drive most of the variance in cost of living around Florida. Key points include:
The cost of living in Weston is 153 with 100 being average.
The cost of living in Weston is 1.5x higher than the national average.
The median home value in Weston is $730,058.
The median income in Weston is $139,825.
Weston's Overall Cost Of Living
Higher Than The National Average
Cost Of Living In Weston Comparison Table
| Living Expense | Weston | Florida | National Average |
|---|---|---|---|
| Overall | 153 | 104 | 100 |
| Services | 102 | 101 | 100 |
| Groceries | 105 | 105 | 100 |
| Health | 261 | 99 | 100 |
| Housing | 106 | 104 | 100 |
| Transportation | 110 | 109 | 100 |
| Utilities | 102 | 105 | 100 |
Source: Cost of living index, normalized to US average = 100
Weston, FL Weather
The average high in Weston is 84.6° and the average low is 67.9°.
There are 89.8 days of precipitation each year.
Expect an average of 52.8 inches of precipitation each year with 0.0 inches of snow.
| Stat | Weston |
|---|---|
| Average Annual High | 84.6 |
| Average Annual Low | 67.9 |
| Annual Precipitation Days | 89.8 |
| Average Annual Precipitation | 52.8 |
| Average Annual Snowfall | 0.0 |
Average High
Days of Rain
Source: NOAA climate normals (30-year)
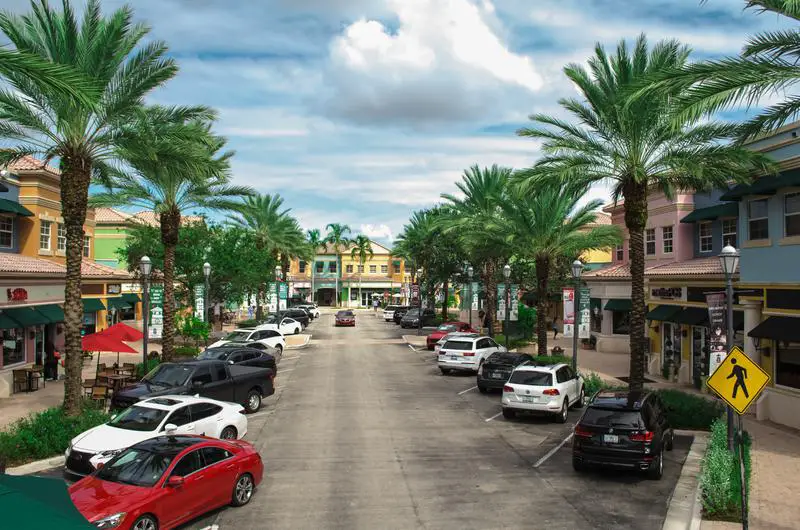
Weston, FL Photos

1 Reviews & Comments About Weston

Weston is very safe very quiet place to live. All of the neighborhoods' associations are strict and keep the communities looking very nice. The schools are good but are overflowing. They used to be great but not anymore. There is a large Venezuelan community that started moving here in the last 10 years. It's almost not necessary to speak English here. There are a lot of restaurants to choose from and businesses. A lot of small parks for kids to play in, activities for kids and also a large dog park at Markham Park. Highways are extremely accessible from both sides of the city and we're 10 minutes away from Sawgrass Mills. City buses and 18 wheelers are not allowed through the city so it's very quiet. Weston has a lot of restrictions but that's what keeps the city very safe and clean. There is also a large regional park and the YMCA and community center are both inside the park. We have an athletic club and tons of karate schools, music schools, gyms, learning centers etc. Cleaveland Clinic is also here and plenty of spas and doctors offices. All in all it is a very family friendly city and they have done a great job in making sure you don't need to leave Weston, we have everything here.
Schools are very overcrowded because there are so many people who want to live here. Cypress Bay High School is a very good school but it's huge. There are two middle schools Falcon Cove and Tequesta Trace and five elementary schools. There are also private schools, Sagemont and Weston Christian Academy and plenty of pre-schools.
Rankings & Articles For Weston


Locations Around Weston
Map Of Weston, FL
Best Places Around Weston
Coral Springs, FL
Population 136,103
Coconut Creek, FL
Population 58,330
Parkland, FL
Population 37,178
Pembroke Pines, FL
Population 173,194
Miami Lakes, FL
Population 31,553
Davie, FL
Population 108,346
Oakland Park, FL
Population 44,682
North Lauderdale, FL
Population 45,234
Hialeah Gardens, FL
Population 22,915
West Park, FL
Population 15,249
Weston Demographics And Statistics
Population over time in Weston
The current population in Weston is 68,837. The population has increased 9.7% from 2010.
| Year | Population | % Change |
|---|---|---|
| 2024 | 68,837 | 1.3% |
| 2023 | 67,952 | -0.1% |
| 2022 | 68,029 | -0.2% |
| 2021 | 68,148 | -4.0% |
| 2020 | 70,965 | 0.5% |
| 2019 | 70,614 | 0.6% |
| 2018 | 70,220 | 0.6% |
| 2017 | 69,802 | 1.3% |
| 2016 | 68,893 | 0.7% |
| 2015 | 68,423 | 1.3% |
| 2014 | 67,567 | 1.7% |
| 2013 | 66,435 | 1.8% |
| 2012 | 65,233 | 2.0% |
| 2011 | 63,925 | 1.9% |
| 2010 | 62,747 | - |
Race / Ethnicity in Weston
See the full breakdown
Weston is:
26.9% White with 18,502 White residents.
3.1% African American with 2,143 African American residents.
0.0% American Indian with 18 American Indian residents.
8.4% Asian with 5,806 Asian residents.
0.0% Hawaiian with 0 Hawaiian residents.
0.9% Other with 593 Other residents.
3.9% Two Or More with 2,664 Two Or More residents.
56.8% Hispanic with 39,111 Hispanic residents.
| Race | Weston | FL | USA |
|---|---|---|---|
| White | 26.9% | 50.4% | 57.4% |
| African American | 3.1% | 14.6% | 11.9% |
| American Indian | 0.0% | 0.1% | 0.5% |
| Asian | 8.4% | 2.9% | 5.9% |
| Hawaiian | 0.0% | 0.1% | 0.2% |
| Other | 0.9% | 0.7% | 0.6% |
| Two Or More | 3.9% | 3.8% | 4.3% |
| Hispanic | 56.8% | 27.4% | 19.3% |
Gender in Weston
See the full breakdown
Weston is 52.6% female with 36,242 female residents.
Weston is 47.4% male with 32,594 male residents.
| Gender | Weston | FL | USA |
|---|---|---|---|
| Female | 52.6% | 50.9% | 50.5% |
| Male | 47.4% | 49.1% | 49.5% |
Highest level of educational attainment in Weston for adults over 25
See the full breakdown
1.0% of adults in Weston completed < 9th grade.
2.0% of adults in Weston completed 9-12th grade.
9.0% of adults in Weston completed high school / ged.
11.0% of adults in Weston completed some college.
9.0% of adults in Weston completed associate's degree.
37.0% of adults in Weston completed bachelor's degree.
20.0% of adults in Weston completed master's degree.
8.0% of adults in Weston completed professional degree.
3.0% of adults in Weston completed doctorate degree.
| Education | Weston | FL | USA |
|---|---|---|---|
| < 9th Grade | 1.0% | 5.0% | 4.0% |
| 9-12th Grade | 2.0% | 6.0% | 6.0% |
| High School / GED | 9.0% | 27.0% | 26.0% |
| Some College | 11.0% | 19.0% | 19.0% |
| Associate's Degree | 9.0% | 10.0% | 9.0% |
| Bachelor's Degree | 37.0% | 21.0% | 22.0% |
| Master's Degree | 20.0% | 9.0% | 10.0% |
| Professional Degree | 8.0% | 2.0% | 2.0% |
| Doctorate Degree | 3.0% | 1.0% | 2.0% |
Household Income For Weston, Florida
See the full breakdown
2.1% of households in Weston earn Less than $10,000.
1.4% of households in Weston earn $10,000 to $14,999.
2.9% of households in Weston earn $15,000 to $24,999.
2.7% of households in Weston earn $25,000 to $34,999.
4.8% of households in Weston earn $35,000 to $49,999.
10.6% of households in Weston earn $50,000 to $74,999.
10.9% of households in Weston earn $75,000 to $99,999.
18.8% of households in Weston earn $100,000 to $149,999.
13.9% of households in Weston earn $150,000 to $199,999.
31.9% of households in Weston earn $200,000 or more.
| Income | Weston | FL | USA |
|---|---|---|---|
| Less than $10,000 | 2.1% | 5.1% | 5.0% |
| $10,000 to $14,999 | 1.4% | 3.3% | 3.4% |
| $15,000 to $24,999 | 2.9% | 6.6% | 6.3% |
| $25,000 to $34,999 | 2.7% | 7.3% | 6.6% |
| $35,000 to $49,999 | 4.8% | 11.1% | 10.1% |
| $50,000 to $74,999 | 10.6% | 16.8% | 15.5% |
| $75,000 to $99,999 | 10.9% | 13.1% | 12.6% |
| $100,000 to $149,999 | 18.8% | 17.2% | 17.5% |
| $150,000 to $199,999 | 13.9% | 8.4% | 9.6% |
| $200,000 or more | 31.9% | 11.0% | 13.4% |
Source: U.S. Census ACS 5-year estimates (2024)


