Acworth, GA
Demographics And Statistics
Living In Acworth, Georgia Summary
Life in Acworth research summary. HomeSnacks has been using Saturday Night Science to research the quality of life in Acworth over the past nine years using Census, FBI, Zillow, and other primary data sources. Based on the most recently available data, we found the following about life in Acworth:
The population in Acworth is 22,370.
The median home value in Acworth is $409,691.
The median income in Acworth is $80,703.
The cost of living in Acworth is 101 which is 1.0x higher than the national average.
The median rent in Acworth is $1,569.
The unemployment rate in Acworth is 5.0%.
The poverty rate in Acworth is 8.3%.
The average high in Acworth is 71.6° and the average low is 49.5°.
Acworth SnackAbility
Overall SnackAbility
Acworth, GA Crime Report
Crime in Acworth summary. We use data from the FBI to determine the crime rates in Acworth. Key points include:
There were 275 total crimes in Acworth in the last reporting year.
The overall crime rate per 100,000 people in Acworth is 1,229.7 / 100k people.
The violent crime rate per 100,000 people in Acworth is 26.8 / 100k people.
The property crime rate per 100,000 people in Acworth is 1,202.8 / 100k people.
Overall, crime in Acworth is -41.98% below the national average.
Total Crimes
Below National Average
Crime In Acworth Comparison Table
| Statistic | Count Raw |
Acworth / 100k People |
Georgia / 100k People |
National / 100k People |
|---|---|---|---|---|
| Total Crimes Per 100K | 275 | 1,229.7 | 2,000.6 | 2,119.2 |
| Violent Crime | 6 | 26.8 | 325.7 | 359.0 |
| Murder | 0 | 0.0 | 6.9 | 5.0 |
| Robbery | 0 | 0.0 | 40.8 | 61.0 |
| Aggravated Assault | 3 | 13.4 | 245.9 | 256.0 |
| Property Crime | 269 | 1,202.8 | 1,674.9 | 1,760.0 |
| Burglary | 5 | 22.4 | 202.8 | 229.0 |
| Larceny | 259 | 1,158.1 | 1,247.3 | 1,272.0 |
| Car Theft | 5 | 22.4 | 224.7 | 259.0 |
Acworth, GA Cost Of Living
Cost of living in Acworth summary. We use data on the cost of living to determine how expensive it is to live in Acworth. Real estate prices drive most of the variance in cost of living around Georgia. Key points include:
The cost of living in Acworth is 101 with 100 being average.
The cost of living in Acworth is 1.0x higher than the national average.
The median home value in Acworth is $409,691.
The median income in Acworth is $80,703.
Acworth's Overall Cost Of Living
Higher Than The National Average
Cost Of Living In Acworth Comparison Table
| Living Expense | Acworth | Georgia | National Average | |
|---|---|---|---|---|
| Overall | 101 | 91 | 100 | |
| Services | 101 | 99 | 100 | |
| Groceries | 97 | 99 | 100 | |
| Health | 94 | 100 | 100 | |
| Housing | 116 | 85 | 100 | |
| Transportation | 95 | 92 | 100 | |
| Utilities | 81 | 86 | 100 | |
Acworth, GA Weather
The average high in Acworth is 71.6° and the average low is 49.5°.
There are 77.5 days of precipitation each year.
Expect an average of 51.9 inches of precipitation each year with 2.3 inches of snow.
| Stat | Acworth |
|---|---|
| Average Annual High | 71.6 |
| Average Annual Low | 49.5 |
| Annual Precipitation Days | 77.5 |
| Average Annual Precipitation | 51.9 |
| Average Annual Snowfall | 2.3 |
Average High
Days of Rain
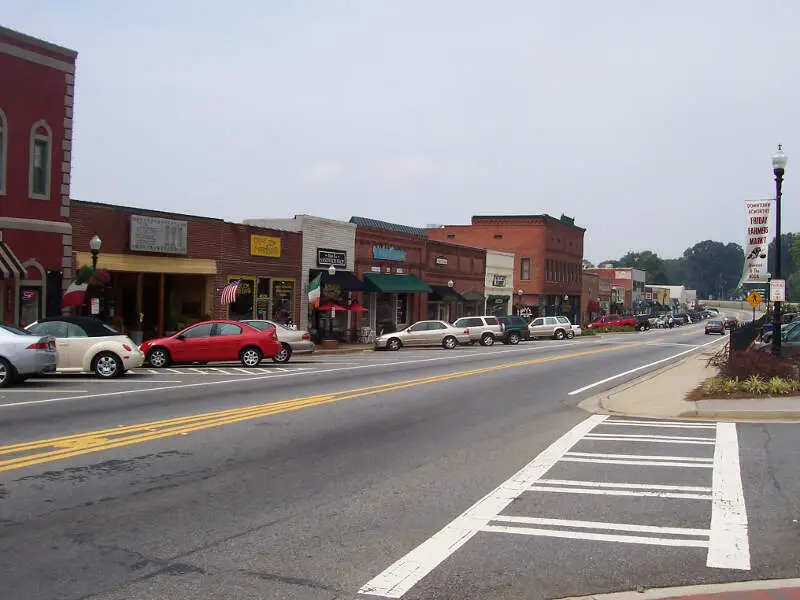
Acworth, GA Photos


1 Reviews & Comments About Acworth
/5

HomeSnacks User - 2018-07-14 07:05:17.213780
There was barely any crime, you could leave your door unlocked till the end of time and no one would try to come in. The schools were close and decent. They weren't elite private schools with all the best everything but there was variety and opportunity especially at the high schools and nearby. There were a couple of public parks, one of them had a two mile track and a full outside gym complete with instructions all free. This park had two playgrounds and lots of parking and restroom space. There were two libraries, events, sports fields, and just overall decent community. The place was clean and small with a population of 20,000 give or take. It wasn't as pretty as some parts of california but it was definitely attractive with roads that actually made sense. I wish i could go back.
The good that stood out was my favorite part: the train. I LOVED hearing the train daily. The bad was though the community was decent not much happened. Was pretty quiet but i enjoyed that 90% of the days.
Rankings for Acworth in Georgia


Locations Around Acworth
Map Of Acworth, GA
Best Places Around Acworth
Roswell, GA
Population 92,577
Mountain Park, GA
Population 13,102
Sandy Springs, GA
Population 107,198
Woodstock, GA
Population 36,297
Kennesaw, GA
Population 33,627
Holly Springs, GA
Population 17,693
Mableton, GA
Population 42,403
Smyrna, GA
Population 56,285
Powder Springs, GA
Population 17,414
Canton, GA
Population 34,587
Acworth Demographics And Statistics
Population over time in Acworth
The current population in Acworth is 22,370. The population has increased 15.7% from 2010.
| Year | Population | % Change |
|---|---|---|
| 2023 | 22,370 | 0.2% |
| 2022 | 22,318 | -0.1% |
| 2021 | 22,330 | -1.6% |
| 2020 | 22,683 | 0.7% |
| 2019 | 22,534 | 0.9% |
| 2018 | 22,336 | 0.8% |
| 2017 | 22,163 | 1.6% |
| 2016 | 21,824 | 1.5% |
| 2015 | 21,512 | 1.6% |
| 2014 | 21,169 | 1.8% |
| 2013 | 20,799 | 2.1% |
| 2012 | 20,367 | 2.5% |
| 2011 | 19,868 | 2.8% |
| 2010 | 19,336 | - |
Race / Ethnicity in Acworth
Acworth is:
53.9% White with 12,065 White residents.
20.3% African American with 4,548 African American residents.
0.0% American Indian with 9 American Indian residents.
2.7% Asian with 613 Asian residents.
0.0% Hawaiian with 0 Hawaiian residents.
0.7% Other with 162 Other residents.
5.3% Two Or More with 1,195 Two Or More residents.
16.9% Hispanic with 3,778 Hispanic residents.
| Race | Acworth | GA | USA |
|---|---|---|---|
| White | 53.9% | 49.8% | 58.2% |
| African American | 20.3% | 31.0% | 12.0% |
| American Indian | 0.0% | 0.1% | 0.5% |
| Asian | 2.7% | 4.3% | 5.7% |
| Hawaiian | 0.0% | 0.1% | 0.2% |
| Other | 0.7% | 0.5% | 0.5% |
| Two Or More | 5.3% | 3.5% | 3.9% |
| Hispanic | 16.9% | 10.7% | 19.0% |
Gender in Acworth
Acworth is 53.9% female with 12,052 female residents.
Acworth is 46.1% male with 10,318 male residents.
| Gender | Acworth | GA | USA |
|---|---|---|---|
| Female | 53.9% | 51.2% | 50.5% |
| Male | 46.1% | 48.8% | 49.5% |
Highest level of educational attainment in Acworth for adults over 25
6.0% of adults in Acworth completed < 9th grade.
4.0% of adults in Acworth completed 9-12th grade.
25.0% of adults in Acworth completed high school / ged.
25.0% of adults in Acworth completed some college.
8.0% of adults in Acworth completed associate's degree.
22.0% of adults in Acworth completed bachelor's degree.
8.0% of adults in Acworth completed master's degree.
1.0% of adults in Acworth completed professional degree.
1.0% of adults in Acworth completed doctorate degree.
| Education | Acworth | GA | USA |
|---|---|---|---|
| < 9th Grade | 6.0% | 3.0% | 5.0% |
| 9-12th Grade | 4.0% | 7.0% | 6.0% |
| High School / GED | 25.0% | 27.0% | 26.0% |
| Some College | 25.0% | 20.0% | 19.0% |
| Associate's Degree | 8.0% | 8.0% | 9.0% |
| Bachelor's Degree | 22.0% | 21.0% | 21.0% |
| Master's Degree | 8.0% | 10.0% | 10.0% |
| Professional Degree | 1.0% | 2.0% | 2.0% |
| Doctorate Degree | 1.0% | 2.0% | 2.0% |
Household Income For Acworth, Georgia
4.9% of households in Acworth earn Less than $10,000.
2.2% of households in Acworth earn $10,000 to $14,999.
7.5% of households in Acworth earn $15,000 to $24,999.
4.8% of households in Acworth earn $25,000 to $34,999.
12.6% of households in Acworth earn $35,000 to $49,999.
15.9% of households in Acworth earn $50,000 to $74,999.
15.1% of households in Acworth earn $75,000 to $99,999.
20.1% of households in Acworth earn $100,000 to $149,999.
8.4% of households in Acworth earn $150,000 to $199,999.
8.4% of households in Acworth earn $200,000 or more.
| Income | Acworth | GA | USA |
|---|---|---|---|
| Less than $10,000 | 4.9% | 5.3% | 4.9% |
| $10,000 to $14,999 | 2.2% | 3.6% | 3.6% |
| $15,000 to $24,999 | 7.5% | 7.0% | 6.6% |
| $25,000 to $34,999 | 4.8% | 7.2% | 6.8% |
| $35,000 to $49,999 | 12.6% | 11.0% | 10.4% |
| $50,000 to $74,999 | 15.9% | 16.2% | 15.7% |
| $75,000 to $99,999 | 15.1% | 13.1% | 12.7% |
| $100,000 to $149,999 | 20.1% | 17.0% | 17.4% |
| $150,000 to $199,999 | 8.4% | 8.7% | 9.3% |
| $200,000 or more | 8.4% | 11.0% | 12.6% |


