We all love the biggest cities that the Peach State has to offer. You know the places like Atlanta and Columbus which make all the headlines.
But there are a bunch of other great large cities in Georgia that don't get as much love.
We're going to change that right now.
Using the most recent Census data, we can tell you about all the places in Georgia with a focus on the biggest. We update the data each year and this is our fourth time doing this.
The Largest Cities In Georgia For 2026:
You can click here to see a full table of the 100 biggest cities in Georgia, along with every other place over 1,000 people big. It is sortable by clicking on the headers.
Read on below to see more on the biggest cities. Or for more reading on places to live in Georgia, check out:
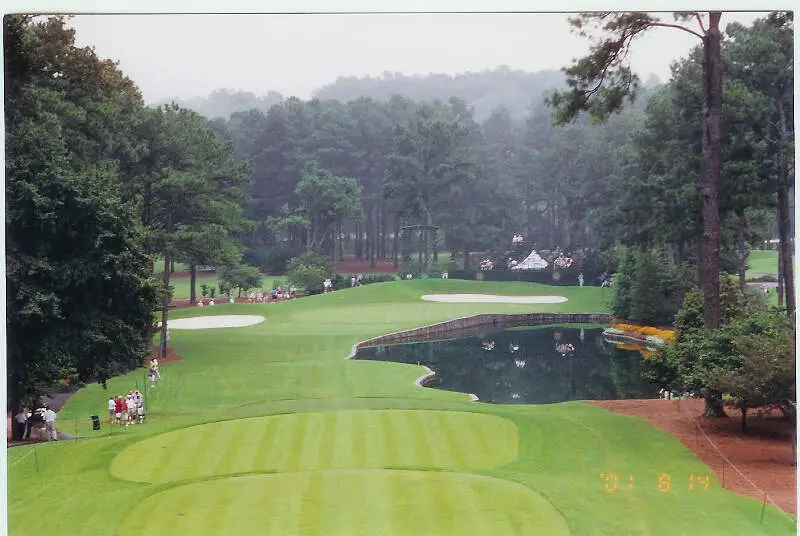
The 10 Biggest Cities In Georgia

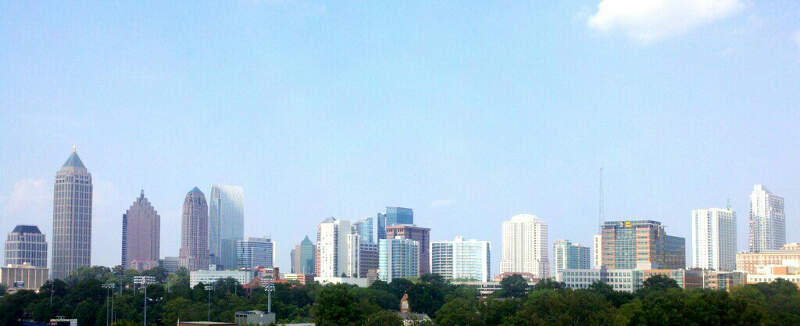
/10
Rank Last Year: 1 (No Change)
Population: 505,268.0
Population 2010: 413,462
Growth: 22.2%
More on Atlanta: Data | Crime | Cost Of Living | Real Estate

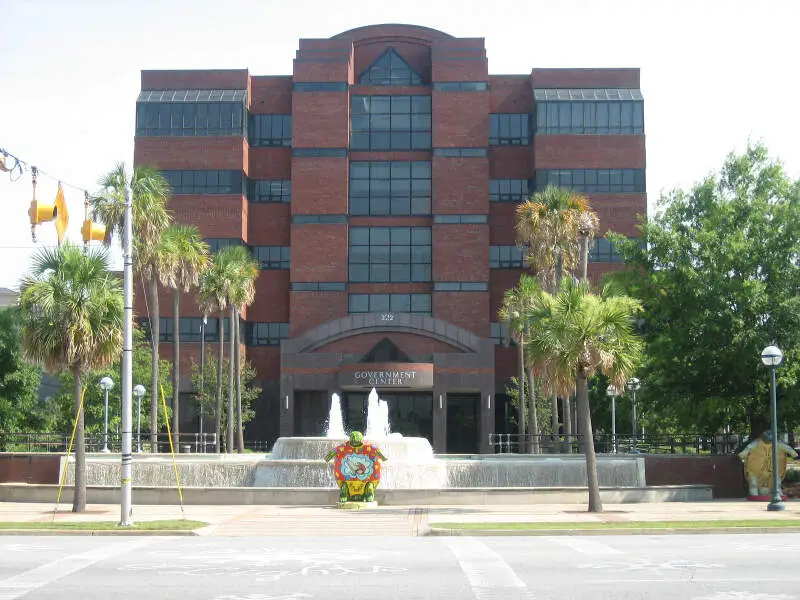
/10
Rank Last Year: 2 (No Change)
Population: 203,711.0
Population 2010: 187,629
Growth: 8.6%
More on Columbus: Data | Cost Of Living | Real Estate
-ga.svg)

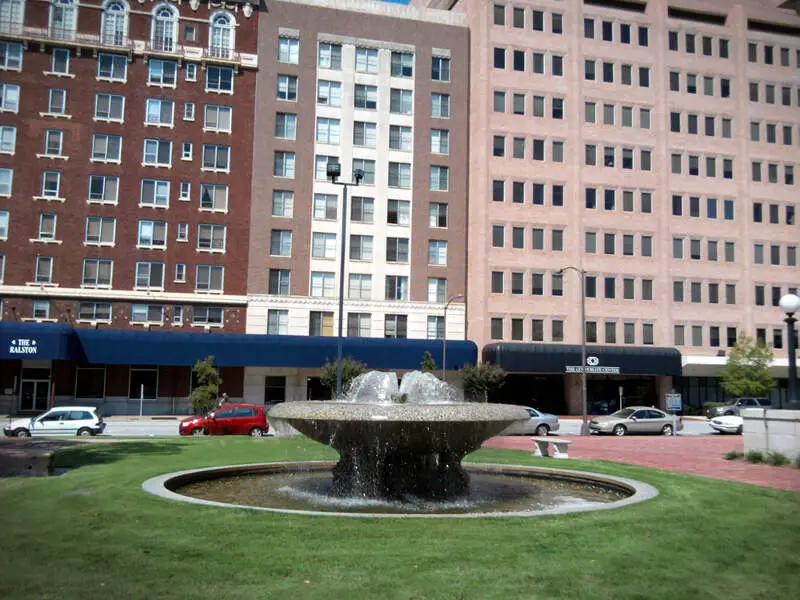
/10
Rank Last Year: 3 (No Change)
Population: 201,528.0
Population 2010: 193,532
Growth: 4.1%
More on Augusta-Richmond County Consolidated Government (Balance): Data | Real Estate

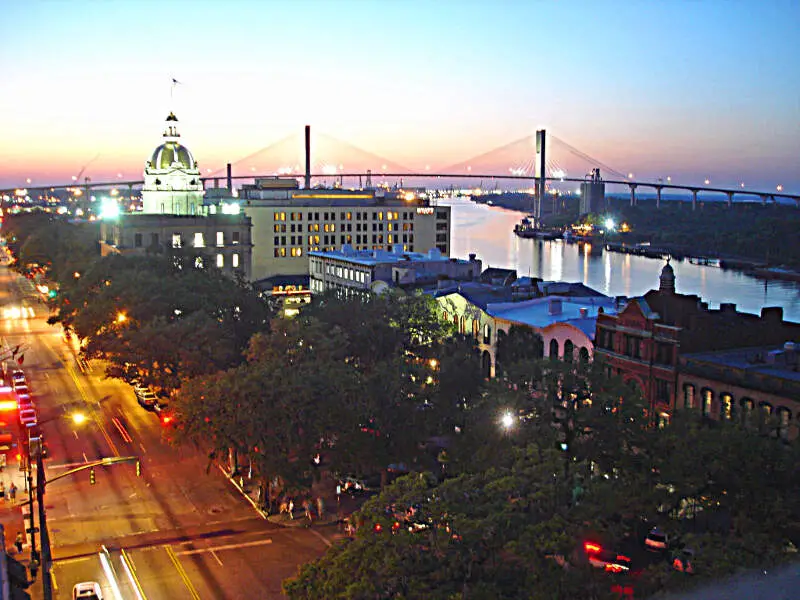
/10
Rank Last Year: 4 (No Change)
Population: 147,898.0
Population 2010: 134,348
Growth: 10.1%
More on Savannah: Data | Cost Of Living | Real Estate
-ga.svg)

/10
Rank Last Year: 5 (No Change)
Population: 127,345.0
Population 2010: 113,608
Growth: 12.1%
More on Athens-Clarke County Unified Government (Balance): Data | Real Estate


/10
Rank Last Year: 6 (No Change)
Population: 107,087.0
Population 2010: 90,826
Growth: 17.9%
More on Sandy Springs: Data | Crime | Cost Of Living | Real Estate


/10
Rank Last Year: 7 (No Change)
Population: 92,621.0
Population 2010: 85,638
Growth: 8.2%
More on Roswell: Data | Crime | Cost Of Living | Real Estate

/10
Rank Last Year: 9 (Up 1)
Population: 82,990.0
Population 2010: 63,271
Growth: 31.2%
More on Warner Robins: Data | Crime | Cost Of Living | Real Estate

/10
Rank Last Year: 8 (Down 1)
Population: 81,988.0
Population 2010: 72,685
Growth: 12.8%
More on Johns Creek: Data | Crime | Cost Of Living | Real Estate

/10
Rank Last Year: 10 (No Change)
Population: 67,224.0
Population 2010: 77,217
Growth: -12.9%
More on Albany: Data | Crime | Cost Of Living | Real Estate
How We Determined The Largest Cities In Georgia
We've been ranking and dissecting cities in the Peach State for over 4 years now -- making this actually the fourth time we've run the numbers. We always use the best data, the US Census. In this case, that means we are using the American Community Survey.
It what is probably the most simple analysis we run each year, we ranked every place in Georgia from biggest to smallest. The biggest city this year? That would be Atlanta.
The smallest? Lumpkin, although there are places smaller than 1,000 people not listed here, so keep that in mind as we take a look at the top ten.
Now on to numbers 11-100 Biggest in Georgia
We hope that you find the big city, or really any city, that's right for you. Below is a list of the rest of the biggest cities along with every other place in Georgia.
Have fun snacking around in the Peach State!
For more reading on Georgia, check out:
- Best Places To Raise A Family In Georgia
- Best Places To Retire In Georgia
- Richest Cities In Georgia
- Safest Places In Georgia
- Worst Places To Live In Georgia
- Most Expensive Places To Live In Georgia
Detailed List Of The Biggest Cities In Georgia
| Rank | City | Current Population | 2010 | Growth |
|---|---|---|---|---|
| 1 | Atlanta | 505,268.0 | 413,462 | 22.2% |
| 2 | Columbus | 203,711.0 | 187,629 | 8.6% |
| 3 | Augusta-Richmond County Consolidated Government (Balance) | 201,528.0 | 193,532 | 4.1% |
| 4 | Savannah | 147,898.0 | 134,348 | 10.1% |
| 5 | Athens-Clarke County Unified Government (Balance) | 127,345.0 | 113,608 | 12.1% |
| 6 | Sandy Springs | 107,087.0 | 90,826 | 17.9% |
| 7 | Roswell | 92,621.0 | 85,638 | 8.2% |
| 8 | Warner Robins | 82,990.0 | 63,271 | 31.2% |
| 9 | Johns Creek | 81,988.0 | 72,685 | 12.8% |
| 10 | Albany | 67,224.0 | 77,217 | -12.9% |
| 11 | Alpharetta | 66,855.0 | 54,723 | 22.2% |
| 12 | Marietta | 62,263.0 | 57,244 | 8.8% |
| 13 | Brookhaven | 57,855.0 | 0 | nan% |
| 14 | Smyrna | 56,633.0 | 50,242 | 12.7% |
| 15 | Valdosta | 55,252.0 | 52,332 | 5.6% |
| 16 | Dunwoody | 51,758.0 | 44,689 | 15.8% |
| 17 | Gainesville | 45,032.0 | 32,881 | 37.0% |
| 18 | Newnan | 44,235.0 | 30,160 | 46.7% |
| 19 | Peachtree Corners | 42,373.0 | 0 | nan% |
| 20 | Milton | 41,546.0 | 29,131 | 42.6% |
| 21 | Peachtree City | 39,576.0 | 34,373 | 15.1% |
| 22 | East Point | 38,335.0 | 34,382 | 11.5% |
| 23 | Rome | 38,189.0 | 36,257 | 5.3% |
| 24 | Douglasville | 37,536.0 | 29,373 | 27.8% |
| 25 | Woodstock | 37,381.0 | 22,027 | 69.7% |
| 26 | Evans | 36,998.0 | 27,793 | 33.1% |
| 27 | Canton | 35,741.0 | 20,775 | 72.0% |
| 28 | Stockbridge | 35,737.0 | 23,689 | 50.9% |
| 29 | Hinesville | 35,679.0 | 32,920 | 8.4% |
| 30 | Kennesaw | 34,605.0 | 28,313 | 22.2% |
| 31 | Dalton | 34,538.0 | 32,373 | 6.7% |
| 32 | Statesboro | 34,149.0 | 27,263 | 25.3% |
| 33 | Martinez | 33,750.0 | 34,895 | -3.3% |
| 34 | Duluth | 32,426.0 | 26,317 | 23.2% |
| 35 | Lagrange | 32,078.0 | 29,067 | 10.4% |
| 36 | Redan | 31,017.0 | 34,208 | -9.3% |
| 37 | Lawrenceville | 30,954.0 | 27,704 | 11.7% |
| 38 | Mcdonough | 30,947.0 | 20,182 | 53.3% |
| 39 | Chamblee | 30,895.0 | 9,751 | 216.8% |
| 40 | Pooler | 28,466.0 | 16,683 | 70.6% |
| 41 | Union City | 27,728.0 | 17,883 | 55.1% |
| 42 | Carrollton | 27,392.0 | 24,196 | 13.2% |
| 43 | Sugar Hill | 26,128.0 | 17,580 | 48.6% |
| 44 | Decatur | 24,518.0 | 19,062 | 28.6% |
| 45 | Cartersville | 24,074.0 | 19,325 | 24.6% |
| 46 | Griffin | 23,761.0 | 23,600 | 0.7% |
| 47 | Perry | 23,001.0 | 13,119 | 75.3% |
| 48 | Acworth | 22,473.0 | 19,336 | 16.2% |
| 49 | Suwanee | 22,349.0 | 14,535 | 53.8% |
| 50 | Snellville | 21,620.0 | 18,276 | 18.3% |
| 51 | Candler-Mcafee | 20,905.0 | 23,386 | -10.6% |
| 52 | Fayetteville | 19,719.0 | 15,264 | 29.2% |
| 53 | Kingsland | 19,627.0 | 15,111 | 29.9% |
| 54 | Forest Park | 19,504.0 | 19,322 | 0.9% |
| 55 | Winder | 19,437.0 | 13,690 | 42.0% |
| 56 | St. Marys | 19,166.0 | 16,833 | 13.9% |
| 57 | Thomasville | 18,666.0 | 18,373 | 1.6% |
| 58 | Holly Springs | 18,627.0 | 8,354 | 123.0% |
| 59 | Villa Rica | 18,551.0 | 12,507 | 48.3% |
| 60 | Conyers | 18,512.0 | 14,574 | 27.0% |
| 61 | North Decatur | 18,442.0 | 17,511 | 5.3% |
| 62 | Calhoun | 18,183.0 | 15,040 | 20.9% |
| 63 | Richmond Hill | 18,181.0 | 8,890 | 104.5% |
| 64 | Powder Springs | 18,009.0 | 13,771 | 30.8% |
| 65 | Norcross | 18,007.0 | 9,209 | 95.5% |
| 66 | Buford | 17,997.0 | 12,032 | 49.6% |
| 67 | North Druid Hills | 17,997.0 | 18,360 | -2.0% |
| 68 | Tifton | 17,210.0 | 16,240 | 6.0% |
| 69 | Grovetown | 17,014.0 | 10,289 | 65.4% |
| 70 | Lithia Springs | 16,875.0 | 17,065 | -1.1% |
| 71 | Fairburn | 16,831.0 | 11,542 | 45.8% |
| 72 | Milledgeville | 16,748.0 | 19,229 | -12.9% |
| 73 | St. Simons | 16,228.0 | 12,854 | 26.2% |
| 74 | Dublin | 16,136.0 | 16,308 | -1.1% |
| 75 | Americus | 15,813.0 | 17,026 | -7.1% |
| 76 | Monroe | 15,648.0 | 13,196 | 18.6% |
| 77 | Loganville | 15,527.0 | 9,638 | 61.1% |
| 78 | Lilburn | 15,390.0 | 11,725 | 31.3% |
| 79 | Brunswick | 15,307.0 | 15,450 | -0.9% |
| 80 | Braselton | 15,178.0 | 6,107 | 148.5% |
| 81 | Jefferson | 14,990.0 | 8,587 | 74.6% |
| 82 | Riverdale | 14,792.0 | 15,042 | -1.7% |
| 83 | Dallas | 14,714.0 | 10,754 | 36.8% |
| 84 | College Park | 14,712.0 | 13,976 | 5.3% |
| 85 | Moultrie | 14,588.0 | 14,256 | 2.3% |
| 86 | Covington | 14,584.0 | 13,199 | 10.5% |
| 87 | Clarkston | 14,557.0 | 7,555 | 92.7% |
| 88 | Bainbridge | 14,404.0 | 12,574 | 14.6% |
| 89 | Vinings | 14,390.0 | 8,598 | 67.4% |
| 90 | Belvedere Park | 14,181.0 | 14,532 | -2.4% |
| 91 | Wilmington Island | 13,905.0 | 15,849 | -12.3% |
| 92 | Waycross | 13,756.0 | 14,728 | -6.6% |
| 93 | Port Wentworth | 12,892.0 | 4,920 | 162.0% |
| 94 | Mountain Park | 12,850.0 | 11,942 | 7.6% |
| 95 | Douglas | 11,749.0 | 11,478 | 2.4% |
| 96 | Lovejoy | 11,508.0 | 5,790 | 98.8% |
| 97 | Georgetown | 11,158.0 | 12,210 | -8.6% |
| 98 | Doraville | 11,134.0 | 8,321 | 33.8% |
| 99 | Flowery Branch | 10,925.0 | 5,096 | 114.4% |
| 100 | Vidalia | 10,752.0 | 10,636 | 1.1% |
| 101 | Scottdale | 10,542.0 | 9,770 | 7.9% |
| 102 | Locust Grove | 10,532.0 | 5,002 | 110.6% |
| 103 | Garden City | 10,426.0 | 8,969 | 16.2% |
| 104 | Fort Oglethorpe | 10,416.0 | 8,879 | 17.3% |
| 105 | Cedartown | 10,227.0 | 9,792 | 4.4% |
| 106 | Cairo | 10,055.0 | 9,548 | 5.3% |
| 107 | Cordele | 9,994.0 | 11,212 | -10.9% |
| 108 | Jesup | 9,942.0 | 10,176 | -2.3% |
| 109 | Thomaston | 9,831.0 | 9,225 | 6.6% |
| 110 | Skidaway Island | 9,315.0 | 8,075 | 15.4% |
| 111 | Fort Stewart | 9,285.0 | 5,622 | 65.2% |
| 112 | Toccoa | 9,238.0 | 8,644 | 6.9% |
| 113 | Irondale | 9,185.0 | 7,445 | 23.4% |
| 114 | Panthersville | 9,053.0 | 10,353 | -12.6% |
| 115 | Fair Oaks | 9,014.0 | 6,401 | 40.8% |
| 116 | Fitzgerald | 8,918.0 | 9,059 | -1.6% |
| 117 | Cusseta-Chattahoochee County Unified Government | 8,887.0 | 11,702 | -24.1% |
| 118 | Fort Valley | 8,858.0 | 9,477 | -6.5% |
| 119 | Country Club Estates | 8,780.0 | 9,302 | -5.6% |
| 120 | Auburn | 8,711.0 | 7,114 | 22.4% |
| 121 | Hampton | 8,687.0 | 6,590 | 31.8% |
| 122 | Centerville | 8,505.0 | 6,760 | 25.8% |
| 123 | Cumming | 8,469.0 | 5,283 | 60.3% |
| 124 | Austell | 8,447.0 | 6,396 | 32.1% |
| 125 | Druid Hills | 8,169.0 | 14,603 | -44.1% |
| 126 | Dock Junction | 8,147.0 | 7,540 | 8.1% |
| 127 | Commerce | 8,013.0 | 6,501 | 23.3% |
| 128 | Tyrone | 7,896.0 | 6,434 | 22.7% |
| 129 | Swainsboro | 7,571.0 | 7,217 | 4.9% |
| 130 | Bremen | 7,488.0 | 5,995 | 24.9% |
| 131 | Dacula | 7,444.0 | 4,416 | 68.6% |
| 132 | Dahlonega | 7,299.0 | 5,062 | 44.2% |
| 133 | Lafayette | 6,967.0 | 7,117 | -2.1% |
| 134 | Gresham Park | 6,935.0 | 8,169 | -15.1% |
| 135 | Whitemarsh Island | 6,886.0 | 7,458 | -7.7% |
| 136 | Thomson | 6,821.0 | 6,714 | 1.6% |
| 137 | Hapeville | 6,630.0 | 6,240 | 6.2% |
| 138 | Stone Mountain | 6,623.0 | 5,992 | 10.5% |
| 139 | Eatonton | 6,515.0 | 6,560 | -0.7% |
| 140 | Morrow | 6,364.0 | 6,281 | 1.3% |
| 141 | Jonesboro | 6,143.0 | 7,505 | -18.1% |
| 142 | Barnesville | 6,121.0 | 6,584 | -7.0% |
| 143 | Byron | 5,971.0 | 4,243 | 40.7% |
| 144 | Temple | 5,901.0 | 3,990 | 47.9% |
| 145 | Oakwood | 5,862.0 | 3,943 | 48.7% |
| 146 | Conley | 5,822.0 | 6,783 | -14.2% |
| 147 | Jackson | 5,741.0 | 4,961 | 15.7% |
| 148 | Waynesboro | 5,644.0 | 5,680 | -0.6% |
| 149 | Adel | 5,641.0 | 5,355 | 5.3% |
| 150 | Sandersville | 5,601.0 | 5,979 | -6.3% |
| 151 | Senoia | 5,589.0 | 3,062 | 82.5% |
| 152 | Eastman | 5,584.0 | 5,124 | 9.0% |
| 153 | Sylvester | 5,489.0 | 6,174 | -11.1% |
| 154 | Fairview | 5,302.0 | 5,944 | -10.8% |
| 155 | Blakely | 5,238.0 | 5,193 | 0.9% |
| 156 | Hiram | 5,231.0 | 3,305 | 58.3% |
| 157 | Social Circle | 5,217.0 | 4,219 | 23.7% |
| 158 | Rockmart | 5,204.0 | 4,171 | 24.8% |
| 159 | Glennville | 5,179.0 | 3,716 | 39.4% |
| 160 | Camilla | 5,124.0 | 5,437 | -5.8% |
| 161 | Adairsville | 4,999.0 | 4,404 | 13.5% |
| 162 | Cornelia | 4,992.0 | 4,145 | 20.4% |
| 163 | Montgomery | 4,976.0 | 3,845 | 29.4% |
| 164 | Nashville | 4,928.0 | 4,960 | -0.6% |
| 165 | Chatsworth | 4,893.0 | 4,248 | 15.2% |
| 166 | Baxley | 4,888.0 | 4,506 | 8.5% |
| 167 | Madison | 4,864.0 | 3,978 | 22.3% |
| 168 | Grayson | 4,858.0 | 2,384 | 103.8% |
| 169 | Cochran | 4,803.0 | 5,204 | -7.7% |
| 170 | Palmetto | 4,797.0 | 4,222 | 13.6% |
| 171 | Hawkinsville | 4,731.0 | 4,572 | 3.5% |
| 172 | Lakeview | 4,723.0 | 5,236 | -9.8% |
| 173 | Elberton | 4,720.0 | 4,741 | -0.4% |
| 174 | Forsyth | 4,642.0 | 3,903 | 18.9% |
| 175 | Folkston | 4,631.0 | 4,565 | 1.4% |
| 176 | Jasper | 4,630.0 | 3,588 | 29.0% |
| 177 | Chattanooga Valley | 4,601.0 | 4,094 | 12.4% |
| 178 | Heron Bay | 4,595.0 | 3,197 | 43.7% |
| 179 | Hartwell | 4,562.0 | 4,473 | 2.0% |
| 180 | Hoschton | 4,534.0 | 1,449 | 212.9% |
| 181 | Summerville | 4,408.0 | 4,573 | -3.6% |
| 182 | Dawsonville | 4,403.0 | 2,327 | 89.2% |
| 183 | Lindale | 4,289.0 | 4,801 | -10.7% |
| 184 | Dawson | 4,247.0 | 4,642 | -8.5% |
| 185 | Ashburn | 4,231.0 | 4,199 | 0.8% |
| 186 | Euharlee | 4,230.0 | 4,033 | 4.9% |
| 187 | Lyons | 4,219.0 | 4,400 | -4.1% |
| 188 | Hazlehurst | 4,092.0 | 4,114 | -0.5% |
| 189 | Quitman | 4,062.0 | 4,020 | 1.0% |
| 190 | Baldwin | 4,000.0 | 3,141 | 27.3% |
| 191 | Metter | 3,989.0 | 4,118 | -3.1% |
| 192 | Rossville | 3,978.0 | 4,038 | -1.5% |
| 193 | Harlem | 3,885.0 | 2,539 | 53.0% |
| 194 | Walthourville | 3,823.0 | 4,102 | -6.8% |
| 195 | Chattahoochee Hills | 3,782.0 | 2,032 | 86.1% |
| 196 | Hephzibah | 3,747.0 | 4,003 | -6.4% |
| 197 | Washington | 3,680.0 | 4,153 | -11.4% |
| 198 | Manchester | 3,631.0 | 4,239 | -14.3% |
| 199 | Greensboro | 3,609.0 | 3,351 | 7.7% |
| 200 | Lakeview Estates | 3,596.0 | 3,086 | 16.5% |
| 201 | Blackshear | 3,578.0 | 3,428 | 4.4% |
| 202 | Leesburg | 3,542.0 | 2,846 | 24.5% |
| 203 | Cleveland | 3,534.0 | 3,254 | 8.6% |
| 204 | Avondale Estates | 3,530.0 | 2,945 | 19.9% |
| 205 | Gray | 3,512.0 | 3,137 | 12.0% |
| 206 | Wrightsville | 3,487.0 | 3,882 | -10.2% |
| 207 | Hahira | 3,451.0 | 2,506 | 37.7% |
| 208 | Ringgold | 3,435.0 | 3,467 | -0.9% |
| 209 | Pendergrass | 3,435.0 | 532 | 545.7% |
| 210 | Nicholls | 3,434.0 | 2,626 | 30.8% |
| 211 | Pelham | 3,433.0 | 3,955 | -13.2% |
| 212 | Alma | 3,426.0 | 3,480 | -1.6% |
| 213 | West Point | 3,403.0 | 3,324 | 2.4% |
| 214 | Hardwick | 3,402.0 | 5,120 | -33.6% |
| 215 | Experiment | 3,387.0 | 3,012 | 12.5% |
| 216 | Watkinsville | 3,350.0 | 2,706 | 23.8% |
| 217 | Bonanza | 3,279.0 | 2,592 | 26.5% |
| 218 | Grantville | 3,251.0 | 2,771 | 17.3% |
| 219 | Hogansville | 3,246.0 | 3,013 | 7.7% |
| 220 | Hannahs Mill | 3,230.0 | 3,703 | -12.8% |
| 221 | Tallapoosa | 3,227.0 | 3,166 | 1.9% |
| 222 | Reed Creek | 3,151.0 | 2,717 | 16.0% |
| 223 | Putney | 3,150.0 | 2,458 | 28.2% |
| 224 | Tybee Island | 3,123.0 | 3,024 | 3.3% |
| 225 | Ocilla | 3,100.0 | 3,445 | -10.0% |
| 226 | Unadilla | 3,064.0 | 4,286 | -28.5% |
| 227 | Alamo | 3,037.0 | 2,968 | 2.3% |
| 228 | Statham | 3,018.0 | 2,906 | 3.9% |
| 229 | Chickamauga | 3,014.0 | 2,987 | 0.9% |
| 230 | Bloomingdale | 3,007.0 | 2,680 | 12.2% |
| 231 | Cuthbert | 2,991.0 | 3,854 | -22.4% |
| 232 | Springfield | 2,974.0 | 2,731 | 8.9% |
| 233 | Lakeland | 2,968.0 | 3,192 | -7.0% |
| 234 | Montezuma | 2,966.0 | 3,590 | -17.4% |
| 235 | Lula | 2,964.0 | 2,621 | 13.1% |
| 236 | Millen | 2,956.0 | 3,199 | -7.6% |
| 237 | Varnell | 2,920.0 | 1,803 | 62.0% |
| 238 | Lake City | 2,909.0 | 2,692 | 8.1% |
| 239 | Soperton | 2,908.0 | 3,166 | -8.1% |
| 240 | Vienna | 2,881.0 | 3,867 | -25.5% |
| 241 | Ball Ground | 2,856.0 | 1,325 | 115.5% |
| 242 | Donalsonville | 2,831.0 | 2,672 | 6.0% |
| 243 | Abbeville | 2,771.0 | 2,743 | 1.0% |
| 244 | Monticello | 2,747.0 | 2,676 | 2.7% |
| 245 | Guyton | 2,740.0 | 1,613 | 69.9% |
| 246 | Pembroke | 2,693.0 | 2,757 | -2.3% |
| 247 | Lithonia | 2,622.0 | 1,763 | 48.7% |
| 248 | Sylvania | 2,618.0 | 3,019 | -13.3% |
| 249 | Berkeley Lake | 2,597.0 | 1,872 | 38.7% |
| 250 | Reidsville | 2,553.0 | 4,288 | -40.5% |
| 251 | Aragon | 2,536.0 | 1,555 | 63.1% |
| 252 | Thunderbolt | 2,533.0 | 2,643 | -4.2% |
| 253 | Claxton | 2,529.0 | 2,675 | -5.5% |
| 254 | Demorest | 2,512.0 | 3,690 | -31.9% |
| 255 | East Dublin | 2,489.0 | 2,377 | 4.7% |
| 256 | Gordon | 2,485.0 | 2,144 | 15.9% |
| 257 | Mount Zion | 2,433.0 | 1,759 | 38.3% |
| 258 | Homerville | 2,432.0 | 2,799 | -13.1% |
| 259 | Gumlog | 2,382.0 | 2,464 | -3.3% |
| 260 | Webster County Unified Government | 2,381.0 | 2,727 | -12.7% |
| 261 | Deenwood | 2,360.0 | 1,495 | 57.9% |
| 262 | Nicholson | 2,335.0 | 1,414 | 65.1% |
| 263 | Brooklet | 2,288.0 | 1,726 | 32.6% |
| 264 | Lavonia | 2,279.0 | 2,352 | -3.1% |
| 265 | Georgetown-Quitman County Unified Government | 2,264.0 | 2,528 | -10.4% |
| 266 | Royston | 2,258.0 | 2,775 | -18.6% |
| 267 | Raoul | 2,253.0 | 2,104 | 7.1% |
| 268 | Davisboro | 2,231.0 | 2,235 | -0.2% |
| 269 | Winterville | 2,223.0 | 1,245 | 78.6% |
| 270 | Kings Bay Base | 2,210.0 | 1,774 | 24.6% |
| 271 | Wrens | 2,187.0 | 3,192 | -31.5% |
| 272 | Midway | 2,185.0 | 2,066 | 5.8% |
| 273 | Louisville | 2,132.0 | 2,839 | -24.9% |
| 274 | Trenton | 2,123.0 | 2,065 | 2.8% |
| 275 | Maysville | 2,086.0 | 1,528 | 36.5% |
| 276 | Twin City | 2,075.0 | 1,677 | 23.7% |
| 277 | Indian Springs | 2,070.0 | 2,496 | -17.1% |
| 278 | Sparks | 2,056.0 | 2,808 | -26.8% |
| 279 | Isle Of Hope | 2,053.0 | 2,273 | -9.7% |
| 280 | Hamilton | 2,043.0 | 977 | 109.1% |
| 281 | Trion | 2,033.0 | 2,684 | -24.3% |
| 282 | Comer | 2,029.0 | 1,486 | 36.5% |
| 283 | Clayton | 2,018.0 | 2,069 | -2.5% |
| 284 | Shannon | 2,012.0 | 1,675 | 20.1% |
| 285 | Bowdon | 2,006.0 | 2,680 | -25.1% |
| 286 | Unionville | 2,000.0 | 1,847 | 8.3% |
| 287 | Warrenton | 2,000.0 | 2,591 | -22.8% |
| 288 | Epworth | 1,994.0 | 398 | 401.0% |
| 289 | Clarkesville | 1,959.0 | 1,506 | 30.1% |
| 290 | Henderson | 1,952.0 | 1,757 | 11.1% |
| 291 | Butler | 1,935.0 | 2,132 | -9.2% |
| 292 | Ellijay | 1,927.0 | 1,780 | 8.3% |
| 293 | Pearson | 1,919.0 | 2,584 | -25.7% |
| 294 | Mount Vernon | 1,913.0 | 2,680 | -28.6% |
| 295 | Morgan | 1,902.0 | 2,076 | -8.4% |
| 296 | Colquitt | 1,898.0 | 2,371 | -19.9% |
| 297 | Ludowici | 1,897.0 | 1,721 | 10.2% |
| 298 | Homer | 1,892.0 | 954 | 98.3% |
| 299 | Sparta | 1,830.0 | 1,656 | 10.5% |
| 300 | Chester | 1,808.0 | 1,774 | 1.9% |
| 301 | Oxford | 1,770.0 | 2,574 | -31.2% |
| 302 | Lincolnton | 1,768.0 | 1,612 | 9.7% |
| 303 | Lookout Mountain | 1,721.0 | 1,844 | -6.7% |
| 304 | Buena Vista | 1,717.0 | 2,111 | -18.7% |
| 305 | Wadley | 1,706.0 | 1,775 | -3.9% |
| 306 | Arcade | 1,704.0 | 1,711 | -0.4% |
| 307 | Union Point | 1,704.0 | 2,057 | -17.2% |
| 308 | Zebulon | 1,698.0 | 1,168 | 45.4% |
| 309 | Walnut Grove | 1,685.0 | 1,793 | -6.0% |
| 310 | Ellaville | 1,668.0 | 1,650 | 1.1% |
| 311 | Tennille | 1,650.0 | 1,866 | -11.6% |
| 312 | Moody Afb | 1,630.0 | 1,087 | 50.0% |
| 313 | Mount Airy | 1,622.0 | 1,142 | 42.0% |
| 314 | Richland | 1,595.0 | 1,982 | -19.5% |
| 315 | Emerson | 1,573.0 | 1,479 | 6.4% |
| 316 | Flemington | 1,571.0 | 978 | 60.6% |
| 317 | Boston | 1,520.0 | 1,403 | 8.3% |
| 318 | Porterdale | 1,466.0 | 1,162 | 26.2% |
| 319 | Darien | 1,452.0 | 2,948 | -50.7% |
| 320 | Bogart | 1,403.0 | 1,470 | -4.6% |
| 321 | Woodbine | 1,399.0 | 1,140 | 22.7% |
| 322 | Mccaysville | 1,392.0 | 1,051 | 32.4% |
| 323 | Nahunta | 1,386.0 | 1,049 | 32.1% |
| 324 | Flovilla | 1,358.0 | 803 | 69.1% |
| 325 | Edison | 1,340.0 | 1,420 | -5.6% |
| 326 | Greenville | 1,326.0 | 686 | 93.3% |
| 327 | Blue Ridge | 1,323.0 | 1,372 | -3.6% |
| 328 | Pine Mountain | 1,314.0 | 1,203 | 9.2% |
| 329 | Buchanan | 1,306.0 | 1,421 | -8.1% |
| 330 | Willacoochee | 1,301.0 | 1,614 | -19.4% |
| 331 | Hiawassee | 1,293.0 | 801 | 61.4% |
| 332 | Hagan | 1,293.0 | 908 | 42.4% |
| 333 | Remerton | 1,280.0 | 1,200 | 6.7% |
| 334 | Fairmount | 1,279.0 | 993 | 28.8% |
| 335 | Rutledge | 1,271.0 | 979 | 29.8% |
| 336 | Roberta | 1,257.0 | 854 | 47.2% |
| 337 | Young Harris | 1,252.0 | 1,192 | 5.0% |
| 338 | Fort Gaines | 1,248.0 | 1,404 | -11.1% |
| 339 | Rochelle | 1,243.0 | 1,425 | -12.8% |
| 340 | Clermont | 1,243.0 | 777 | 60.0% |
| 341 | Lake Park | 1,234.0 | 577 | 113.9% |
| 342 | Dutch Island | 1,225.0 | 1,219 | 0.5% |
| 343 | Omega | 1,194.0 | 1,814 | -34.2% |
| 344 | Robins Afb | 1,193.0 | 1,098 | 8.7% |
| 345 | East Griffin | 1,174.0 | 1,274 | -7.8% |
| 346 | Nelson | 1,166.0 | 752 | 55.1% |
| 347 | Enigma | 1,140.0 | 1,220 | -6.6% |
| 348 | Resaca | 1,126.0 | 804 | 40.0% |
| 349 | Norman Park | 1,116.0 | 1,024 | 9.0% |
| 350 | Franklin Springs | 1,108.0 | 881 | 25.8% |
| 351 | Sycamore | 1,096.0 | 372 | 194.6% |
| 352 | Russell | 1,089.0 | 1,623 | -32.9% |
| 353 | Cave Spring | 1,080.0 | 1,049 | 3.0% |
| 354 | Satilla | 1,057.0 | 206 | 413.1% |
| 355 | Alto | 1,055.0 | 1,398 | -24.5% |
| 356 | Dexter | 1,054.0 | 650 | 62.2% |
| 357 | Marshallville | 1,046.0 | 1,297 | -19.4% |
| 358 | Sunnyside | 1,031.0 | 1,578 | -34.7% |
| 359 | Broxton | 1,031.0 | 1,222 | -15.6% |
| 360 | Crawford | 1,016.0 | 972 | 4.5% |
| 361 | Hoboken | 1,016.0 | 542 | 87.5% |
| 362 | Arlington | 1,014.0 | 1,522 | -33.4% |
| 363 | Jeffersonville | 1,008.0 | 1,170 | -13.8% |
| 364 | Mountain City | 1,004.0 | 707 | 42.0% |
| 365 | Lumber City | 1,004.0 | 2,021 | -50.3% |
| 366 | Luthersville | 1,000.0 | 670 | 49.3% |
| 367 | Lumpkin | 1,000.0 | 2,472 | -59.5% |