Albany SnackAbility
Overall SnackAbility
Crime in Albany summary. We use data from the FBI to determine the crime rates in Albany. Key points include:
There were 1,609 total crimes in Albany in the last reporting year.
The overall crime rate per 100,000 people in Albany is 2,431.7 / 100k people.
The violent crime rate per 100,000 people in Albany is 823.6 / 100k people.
The property crime rate per 100,000 people in Albany is 1,608.0 / 100k people.
Overall, crime in Albany is 14.74% above the national average.
Total Crimes
Above National Average
Crime In Albany Comparison Table
| Statistic | Count Raw |
Albany / 100k People |
Georgia / 100k People |
National / 100k People |
|---|---|---|---|---|
| Total Crimes Per 100K | 1,609 | 2,431.7 | 2,000.6 | 2,119.2 |
| Violent Crime | 545 | 823.6 | 325.7 | 359.0 |
| Murder | 17 | 25.7 | 6.9 | 5.0 |
| Robbery | 35 | 52.9 | 40.8 | 61.0 |
| Aggravated Assault | 454 | 686.1 | 245.9 | 256.0 |
| Property Crime | 1,064 | 1,608.0 | 1,674.9 | 1,760.0 |
| Burglary | 136 | 205.5 | 202.8 | 229.0 |
| Larceny | 818 | 1,236.2 | 1,247.3 | 1,272.0 |
| Car Theft | 110 | 166.2 | 224.7 | 259.0 |
Source: FBI Uniform Crime Reporting (2024)
Cost of living in Albany summary. We use data on the cost of living to determine how expensive it is to live in Albany. Real estate prices drive most of the variance in cost of living around Georgia. Key points include:
The cost of living in Albany is 89 with 100 being average.
The cost of living in Albany is 0.9x lower than the national average.
The median home value in Albany is $129,373.
The median income in Albany is $47,240.
Albany's Overall Cost Of Living
Lower Than The National Average
Cost Of Living In Albany Comparison Table
| Living Expense | Albany | Georgia | National Average |
|---|---|---|---|
| Overall | 89 | 95 | 100 |
| Services | 97 | 97 | 100 |
| Groceries | 99 | 99 | 100 |
| Health | 61 | 88 | 100 |
| Housing | 99 | 101 | 100 |
| Transportation | 99 | 104 | 100 |
| Utilities | 102 | 101 | 100 |
Source: Cost of living index, normalized to US average = 100
Albany, GA Weather
The average high in Albany is 78.0° and the average low is 54.7°.
There are 72.6 days of precipitation each year.
Expect an average of 50.0 inches of precipitation each year with 0.0 inches of snow.
| Stat | Albany |
|---|---|
| Average Annual High | 78.0 |
| Average Annual Low | 54.7 |
| Annual Precipitation Days | 72.6 |
| Average Annual Precipitation | 50.0 |
| Average Annual Snowfall | 0.0 |
Average High
Days of Rain
Source: NOAA climate normals (30-year)
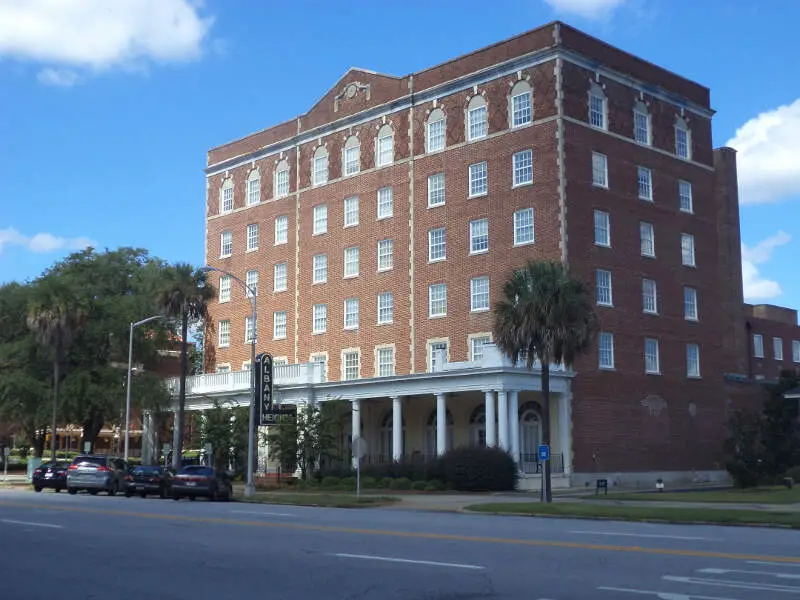
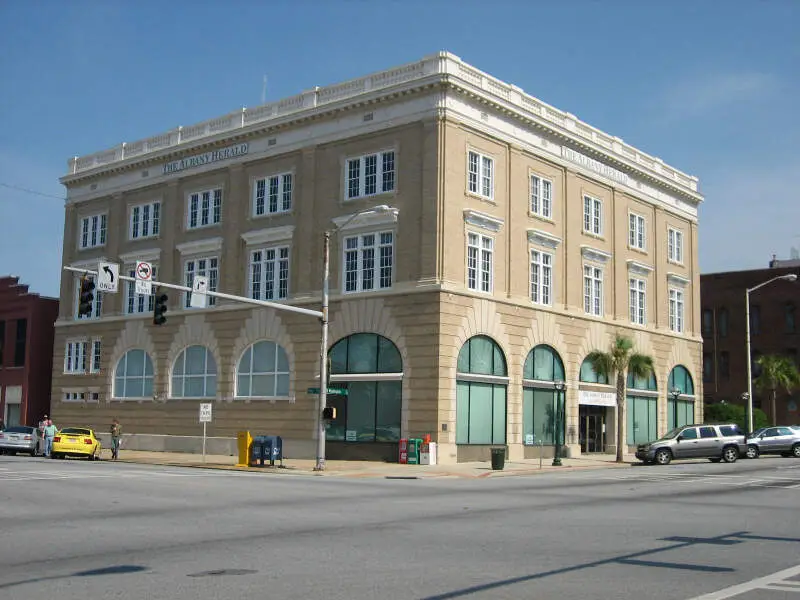
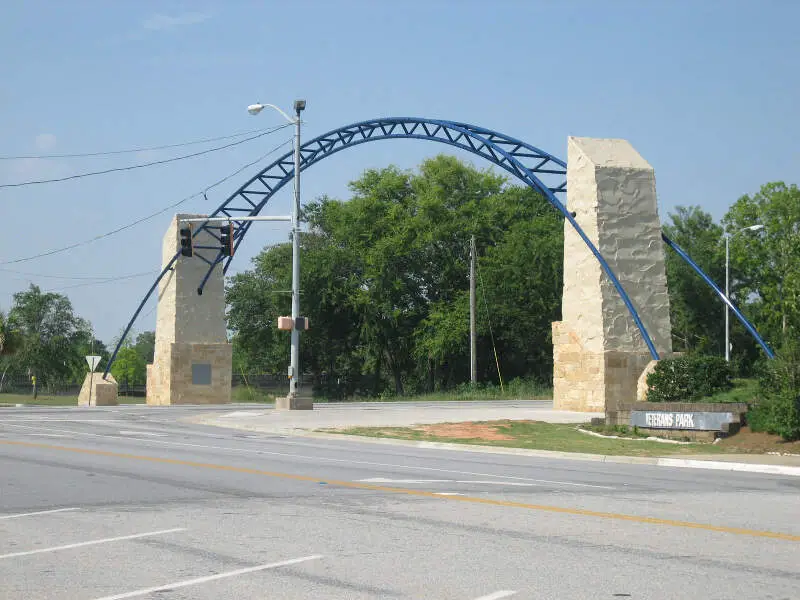
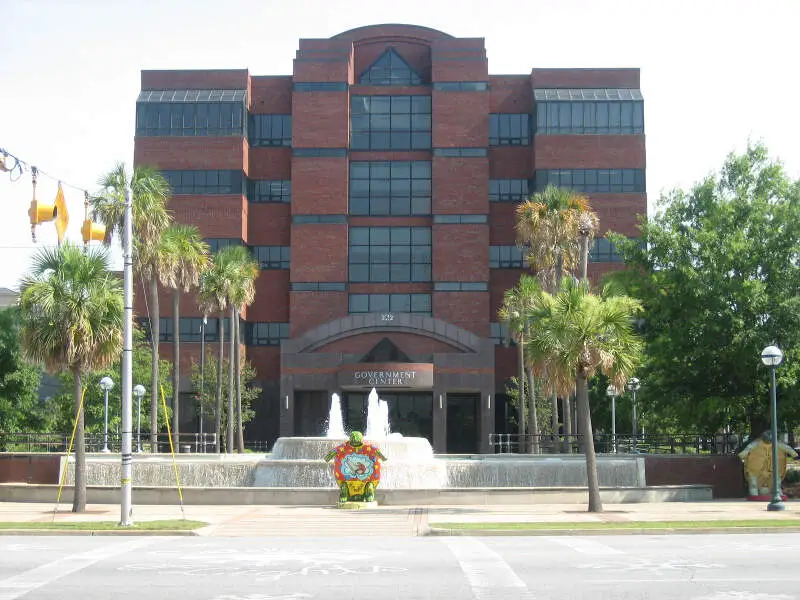
Albany, GA Photos


2 Reviews & Comments About Albany

I've lived in Albany for all of my life and I've seen my fair share of crime but Albany Ga is the heartbeat of the south. We've been through a total of 2 Tornadoes and 1 Hurricane and when it counts the most we stick together. There is so much love in Albany everyone is friendly. The city has a pure heart of gold.
Some of the favorite places to visit that I enjoy personally is "Little Red Dog House" which a local favorite hot dog stand. Another place to eat that is heavily enjoyed by locals is the "Albany Fish Company" where they served delicious seafood.
Hello. I am from Albany, Ga
Albany has a lot to be desired, but before giving such a harsh opinion about it, please include every kind of shopping experience rather than finding the worse possible picture of a store that looks like a personal care facility.
Rankings & Articles For Albany


Locations Around Albany
Map Of Albany, GA
Best Places Around Albany
Cairo, GA
Population 10,055
Tifton, GA
Population 17,210
Blakely, GA
Population 5,238
Sylvester, GA
Population 5,489
Camilla, GA
Population 5,124
Moultrie, GA
Population 14,588
Americus, GA
Population 15,813
Cordele, GA
Population 9,994
Albany Demographics And Statistics
Population over time in Albany
The current population in Albany is 67,224. The population has decreased 12.9% from 2010.
| Year | Population | % Change |
|---|---|---|
| 2024 | 67,224 | -1.1% |
| 2023 | 67,939 | -1.4% |
| 2022 | 68,926 | -2.6% |
| 2021 | 70,748 | -2.6% |
| 2020 | 72,634 | -1.1% |
| 2019 | 73,478 | -1.5% |
| 2018 | 74,631 | -0.3% |
| 2017 | 74,892 | -1.0% |
| 2016 | 75,657 | -1.1% |
| 2015 | 76,466 | -0.6% |
| 2014 | 76,946 | -0.3% |
| 2013 | 77,196 | -0.3% |
| 2012 | 77,435 | 0.0% |
| 2011 | 77,400 | 0.2% |
| 2010 | 77,217 | - |
Race / Ethnicity in Albany
See the full breakdown
Albany is:
17.4% White with 11,729 White residents.
76.4% African American with 51,335 African American residents.
0.1% American Indian with 72 American Indian residents.
0.6% Asian with 382 Asian residents.
0.0% Hawaiian with 0 Hawaiian residents.
0.3% Other with 220 Other residents.
2.5% Two Or More with 1,698 Two Or More residents.
2.7% Hispanic with 1,788 Hispanic residents.
| Race | Albany | GA | USA |
|---|---|---|---|
| White | 17.4% | 49.1% | 57.4% |
| African American | 76.4% | 30.7% | 11.9% |
| American Indian | 0.1% | 0.1% | 0.5% |
| Asian | 0.6% | 4.5% | 5.9% |
| Hawaiian | 0.0% | 0.1% | 0.2% |
| Other | 0.3% | 0.6% | 0.6% |
| Two Or More | 2.5% | 3.9% | 4.3% |
| Hispanic | 2.7% | 11.0% | 19.3% |
Gender in Albany
See the full breakdown
Albany is 54.4% female with 36,602 female residents.
Albany is 45.6% male with 30,622 male residents.
| Gender | Albany | GA | USA |
|---|---|---|---|
| Female | 54.4% | 51.2% | 50.5% |
| Male | 45.6% | 48.8% | 49.5% |
Highest level of educational attainment in Albany for adults over 25
See the full breakdown
3.0% of adults in Albany completed < 9th grade.
11.0% of adults in Albany completed 9-12th grade.
32.0% of adults in Albany completed high school / ged.
22.0% of adults in Albany completed some college.
10.0% of adults in Albany completed associate's degree.
11.0% of adults in Albany completed bachelor's degree.
7.0% of adults in Albany completed master's degree.
2.0% of adults in Albany completed professional degree.
2.0% of adults in Albany completed doctorate degree.
| Education | Albany | GA | USA |
|---|---|---|---|
| < 9th Grade | 3.0% | 4.0% | 4.0% |
| 9-12th Grade | 11.0% | 7.0% | 6.0% |
| High School / GED | 32.0% | 27.0% | 26.0% |
| Some College | 22.0% | 19.0% | 19.0% |
| Associate's Degree | 10.0% | 8.0% | 9.0% |
| Bachelor's Degree | 11.0% | 21.0% | 22.0% |
| Master's Degree | 7.0% | 10.0% | 10.0% |
| Professional Degree | 2.0% | 2.0% | 2.0% |
| Doctorate Degree | 2.0% | 2.0% | 2.0% |
Household Income For Albany, Georgia
See the full breakdown
11.2% of households in Albany earn Less than $10,000.
7.2% of households in Albany earn $10,000 to $14,999.
11.2% of households in Albany earn $15,000 to $24,999.
9.4% of households in Albany earn $25,000 to $34,999.
15.1% of households in Albany earn $35,000 to $49,999.
20.2% of households in Albany earn $50,000 to $74,999.
11.1% of households in Albany earn $75,000 to $99,999.
8.9% of households in Albany earn $100,000 to $149,999.
2.6% of households in Albany earn $150,000 to $199,999.
3.1% of households in Albany earn $200,000 or more.
| Income | Albany | GA | USA |
|---|---|---|---|
| Less than $10,000 | 11.2% | 5.4% | 5.0% |
| $10,000 to $14,999 | 7.2% | 3.4% | 3.4% |
| $15,000 to $24,999 | 11.2% | 6.6% | 6.3% |
| $25,000 to $34,999 | 9.4% | 6.8% | 6.6% |
| $35,000 to $49,999 | 15.1% | 10.7% | 10.1% |
| $50,000 to $74,999 | 20.2% | 15.9% | 15.5% |
| $75,000 to $99,999 | 11.1% | 13.0% | 12.6% |
| $100,000 to $149,999 | 8.9% | 17.3% | 17.5% |
| $150,000 to $199,999 | 2.6% | 9.2% | 9.6% |
| $200,000 or more | 3.1% | 11.9% | 13.4% |
Source: U.S. Census ACS 5-year estimates (2024)


