Alpharetta SnackAbility
Overall SnackAbility
Crime in Alpharetta summary. We use data from the FBI to determine the crime rates in Alpharetta. Key points include:
There were 950 total crimes in Alpharetta in the last reporting year.
The overall crime rate per 100,000 people in Alpharetta is 1,401.4 / 100k people.
The violent crime rate per 100,000 people in Alpharetta is 249.3 / 100k people.
The property crime rate per 100,000 people in Alpharetta is 1,152.1 / 100k people.
Overall, crime in Alpharetta is -33.87% below the national average.
Total Crimes
Below National Average
Crime In Alpharetta Comparison Table
| Statistic | Count Raw |
Alpharetta / 100k People |
Georgia / 100k People |
National / 100k People |
|---|---|---|---|---|
| Total Crimes Per 100K | 950 | 1,401.4 | 2,000.6 | 2,119.2 |
| Violent Crime | 169 | 249.3 | 325.7 | 359.0 |
| Murder | 1 | 1.5 | 6.9 | 5.0 |
| Robbery | 8 | 11.8 | 40.8 | 61.0 |
| Aggravated Assault | 145 | 213.9 | 245.9 | 256.0 |
| Property Crime | 781 | 1,152.1 | 1,674.9 | 1,760.0 |
| Burglary | 51 | 75.2 | 202.8 | 229.0 |
| Larceny | 691 | 1,019.4 | 1,247.3 | 1,272.0 |
| Car Theft | 39 | 57.5 | 224.7 | 259.0 |
Source: FBI Uniform Crime Reporting (2024)
Cost of living in Alpharetta summary. We use data on the cost of living to determine how expensive it is to live in Alpharetta. Real estate prices drive most of the variance in cost of living around Georgia. Key points include:
The cost of living in Alpharetta is 137 with 100 being average.
The cost of living in Alpharetta is 1.4x higher than the national average.
The median home value in Alpharetta is $726,349.
The median income in Alpharetta is $147,612.
Alpharetta's Overall Cost Of Living
Higher Than The National Average
Cost Of Living In Alpharetta Comparison Table
| Living Expense | Alpharetta | Georgia | National Average |
|---|---|---|---|
| Overall | 137 | 95 | 100 |
| Services | 99 | 97 | 100 |
| Groceries | 99 | 99 | 100 |
| Health | 220 | 88 | 100 |
| Housing | 102 | 101 | 100 |
| Transportation | 101 | 104 | 100 |
| Utilities | 103 | 101 | 100 |
Source: Cost of living index, normalized to US average = 100
Alpharetta, GA Weather
The average high in Alpharetta is 70.5° and the average low is 49.3°.
There are 76.2 days of precipitation each year.
Expect an average of 52.6 inches of precipitation each year with 1.6 inches of snow.
| Stat | Alpharetta |
|---|---|
| Average Annual High | 70.5 |
| Average Annual Low | 49.3 |
| Annual Precipitation Days | 76.2 |
| Average Annual Precipitation | 52.6 |
| Average Annual Snowfall | 1.6 |
Average High
Days of Rain
Source: NOAA climate normals (30-year)
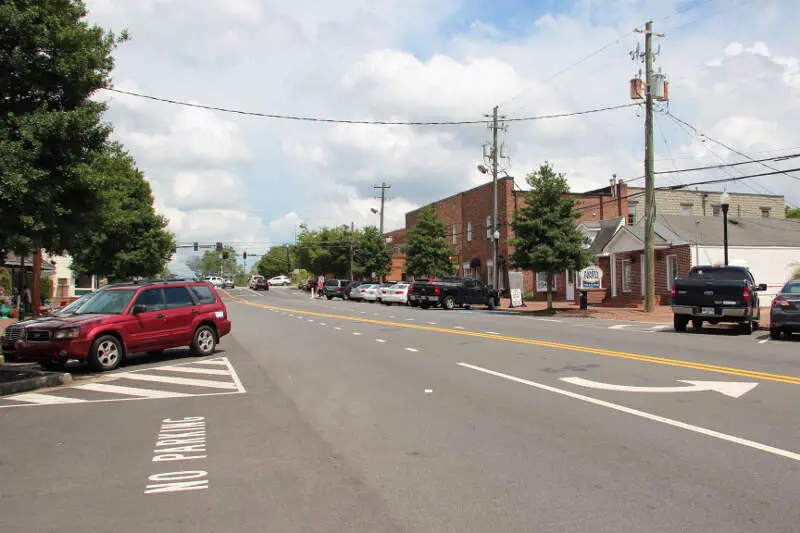
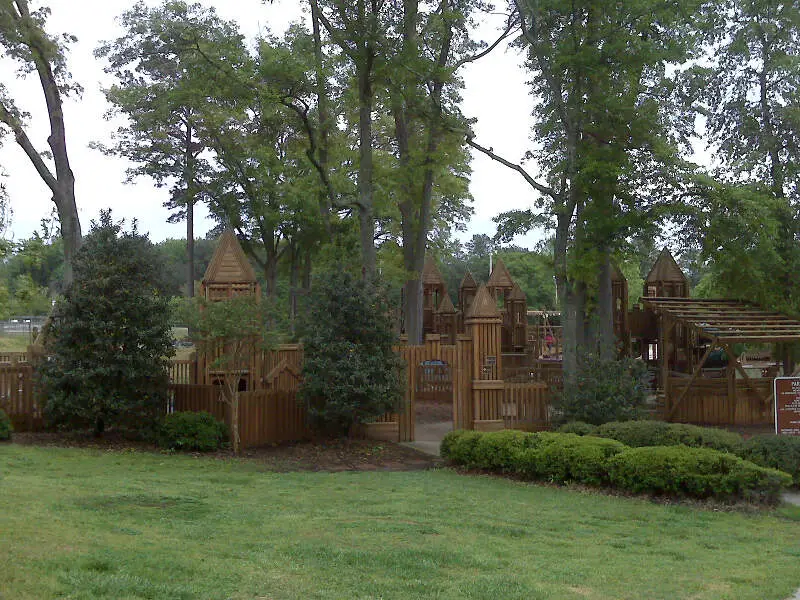
Alpharetta, GA Photos


2 Reviews & Comments About Alpharetta

The schools here are great. They are safe and the teachers really care for your success. My alma mater we had a lot of graduates go off to really great colleges and it's great that these schools are public.
Alpharetta has a lot of white and asian affluent people so not a lot of diversity. The houses here are expensive but it is worth it as the area not only has great schools but is comfortable. There are clean and safe parks situated everywhere.
My Grandmother lived in Alpharetta when I was growing up and I still have family there. It would take a lot of money to get me to live there. All the transplants have ruined it.
Rankings & Articles For Alpharetta


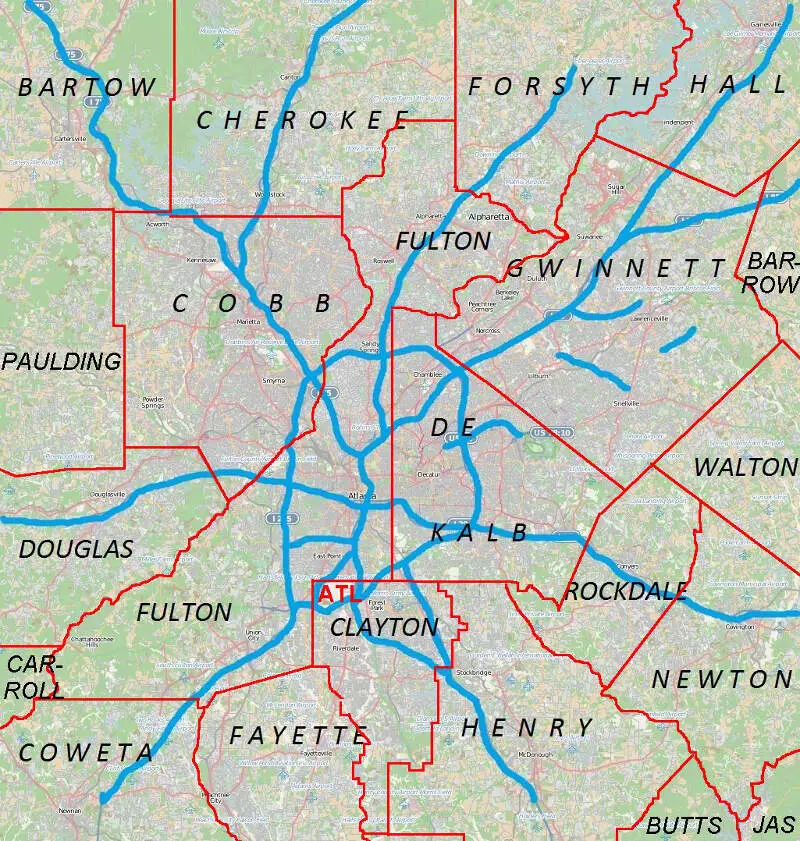
Locations Around Alpharetta
Map Of Alpharetta, GA
Best Places Around Alpharetta
Roswell, GA
Population 92,621
Mountain Park, GA
Population 12,850
Mountain Park, GA
Population 12,850
Sandy Springs, GA
Population 107,087
Johns Creek, GA
Population 81,988
Suwanee, GA
Population 22,349
Woodstock, GA
Population 37,381
Duluth, GA
Population 32,426
Sugar Hill, GA
Population 26,128
Druid Hills, GA
Population 8,169
Alpharetta Demographics And Statistics
Population over time in Alpharetta
The current population in Alpharetta is 66,855. The population has increased 22.2% from 2010.
| Year | Population | % Change |
|---|---|---|
| 2024 | 66,855 | 0.8% |
| 2023 | 66,355 | 0.7% |
| 2022 | 65,884 | 1.1% |
| 2021 | 65,187 | -2.1% |
| 2020 | 66,566 | 1.5% |
| 2019 | 65,590 | 1.4% |
| 2018 | 64,672 | 1.2% |
| 2017 | 63,929 | 1.5% |
| 2016 | 63,013 | 1.5% |
| 2015 | 62,054 | 1.9% |
| 2014 | 60,903 | 2.3% |
| 2013 | 59,553 | 2.5% |
| 2012 | 58,075 | 3.1% |
| 2011 | 56,316 | 2.9% |
| 2010 | 54,723 | - |
Race / Ethnicity in Alpharetta
See the full breakdown
Alpharetta is:
52.2% White with 34,914 White residents.
11.2% African American with 7,508 African American residents.
0.1% American Indian with 47 American Indian residents.
20.4% Asian with 13,626 Asian residents.
0.0% Hawaiian with 3 Hawaiian residents.
1.9% Other with 1,257 Other residents.
4.8% Two Or More with 3,196 Two Or More residents.
9.4% Hispanic with 6,304 Hispanic residents.
| Race | Alpharetta | GA | USA |
|---|---|---|---|
| White | 52.2% | 49.1% | 57.4% |
| African American | 11.2% | 30.7% | 11.9% |
| American Indian | 0.1% | 0.1% | 0.5% |
| Asian | 20.4% | 4.5% | 5.9% |
| Hawaiian | 0.0% | 0.1% | 0.2% |
| Other | 1.9% | 0.6% | 0.6% |
| Two Or More | 4.8% | 3.9% | 4.3% |
| Hispanic | 9.4% | 11.0% | 19.3% |
Gender in Alpharetta
See the full breakdown
Alpharetta is 50.6% female with 33,820 female residents.
Alpharetta is 49.4% male with 33,035 male residents.
| Gender | Alpharetta | GA | USA |
|---|---|---|---|
| Female | 50.6% | 51.2% | 50.5% |
| Male | 49.4% | 48.8% | 49.5% |
Highest level of educational attainment in Alpharetta for adults over 25
See the full breakdown
2.0% of adults in Alpharetta completed < 9th grade.
1.0% of adults in Alpharetta completed 9-12th grade.
9.0% of adults in Alpharetta completed high school / ged.
11.0% of adults in Alpharetta completed some college.
6.0% of adults in Alpharetta completed associate's degree.
40.0% of adults in Alpharetta completed bachelor's degree.
24.0% of adults in Alpharetta completed master's degree.
5.0% of adults in Alpharetta completed professional degree.
2.0% of adults in Alpharetta completed doctorate degree.
| Education | Alpharetta | GA | USA |
|---|---|---|---|
| < 9th Grade | 2.0% | 4.0% | 4.0% |
| 9-12th Grade | 1.0% | 7.0% | 6.0% |
| High School / GED | 9.0% | 27.0% | 26.0% |
| Some College | 11.0% | 19.0% | 19.0% |
| Associate's Degree | 6.0% | 8.0% | 9.0% |
| Bachelor's Degree | 40.0% | 21.0% | 22.0% |
| Master's Degree | 24.0% | 10.0% | 10.0% |
| Professional Degree | 5.0% | 2.0% | 2.0% |
| Doctorate Degree | 2.0% | 2.0% | 2.0% |
Household Income For Alpharetta, Georgia
See the full breakdown
2.8% of households in Alpharetta earn Less than $10,000.
0.6% of households in Alpharetta earn $10,000 to $14,999.
4.4% of households in Alpharetta earn $15,000 to $24,999.
4.1% of households in Alpharetta earn $25,000 to $34,999.
5.3% of households in Alpharetta earn $35,000 to $49,999.
8.5% of households in Alpharetta earn $50,000 to $74,999.
9.4% of households in Alpharetta earn $75,000 to $99,999.
15.5% of households in Alpharetta earn $100,000 to $149,999.
11.8% of households in Alpharetta earn $150,000 to $199,999.
37.5% of households in Alpharetta earn $200,000 or more.
| Income | Alpharetta | GA | USA |
|---|---|---|---|
| Less than $10,000 | 2.8% | 5.4% | 5.0% |
| $10,000 to $14,999 | 0.6% | 3.4% | 3.4% |
| $15,000 to $24,999 | 4.4% | 6.6% | 6.3% |
| $25,000 to $34,999 | 4.1% | 6.8% | 6.6% |
| $35,000 to $49,999 | 5.3% | 10.7% | 10.1% |
| $50,000 to $74,999 | 8.5% | 15.9% | 15.5% |
| $75,000 to $99,999 | 9.4% | 13.0% | 12.6% |
| $100,000 to $149,999 | 15.5% | 17.3% | 17.5% |
| $150,000 to $199,999 | 11.8% | 9.2% | 9.6% |
| $200,000 or more | 37.5% | 11.9% | 13.4% |
Source: U.S. Census ACS 5-year estimates (2024)


