Brunswick SnackAbility
Overall SnackAbility
Cost of living in Brunswick summary. We use data on the cost of living to determine how expensive it is to live in Brunswick. Real estate prices drive most of the variance in cost of living around Georgia. Key points include:
The cost of living in Brunswick is 90 with 100 being average.
The cost of living in Brunswick is 0.9x lower than the national average.
The median home value in Brunswick is $254,063.
The median income in Brunswick is $40,288.
Brunswick's Overall Cost Of Living
Lower Than The National Average
Cost Of Living In Brunswick Comparison Table
| Living Expense | Brunswick | Georgia | National Average |
|---|---|---|---|
| Overall | 90 | 95 | 100 |
| Services | 99 | 97 | 100 |
| Groceries | 99 | 99 | 100 |
| Health | 62 | 88 | 100 |
| Housing | 103 | 101 | 100 |
| Transportation | 104 | 104 | 100 |
| Utilities | 98 | 101 | 100 |
Source: Cost of living index, normalized to US average = 100
Brunswick, GA Weather
The average high in Brunswick is 77.2° and the average low is 57.6°.
There are 65.3 days of precipitation each year.
Expect an average of 49.5 inches of precipitation each year with 0.0 inches of snow.
| Stat | Brunswick |
|---|---|
| Average Annual High | 77.2 |
| Average Annual Low | 57.6 |
| Annual Precipitation Days | 65.3 |
| Average Annual Precipitation | 49.5 |
| Average Annual Snowfall | 0.0 |
Average High
Days of Rain
Source: NOAA climate normals (30-year)
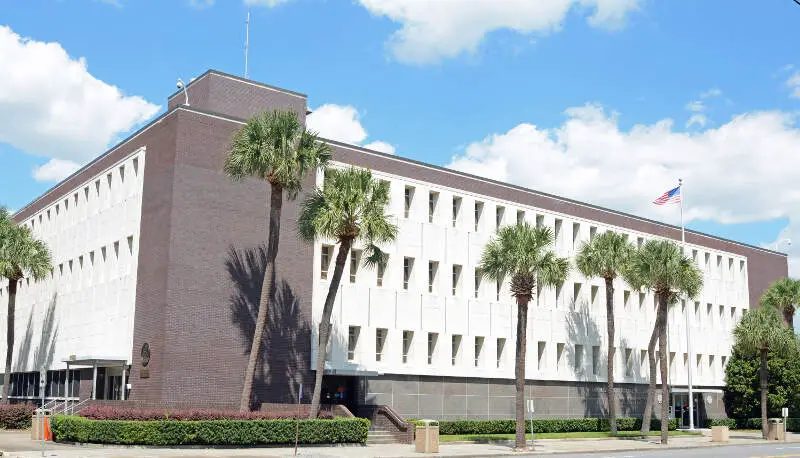
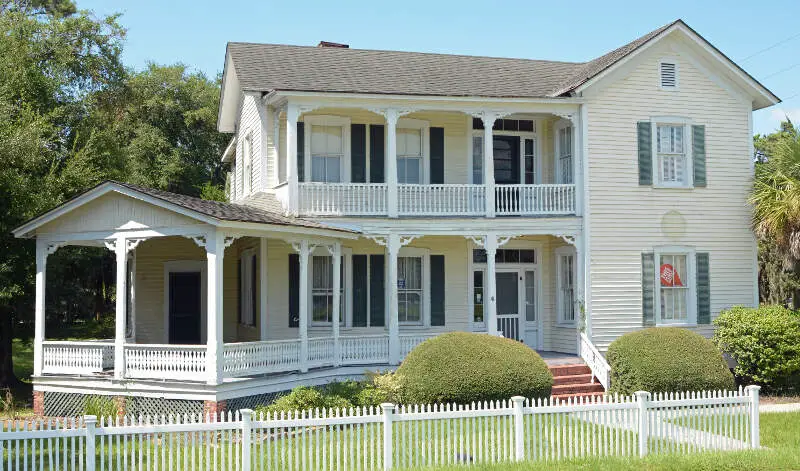
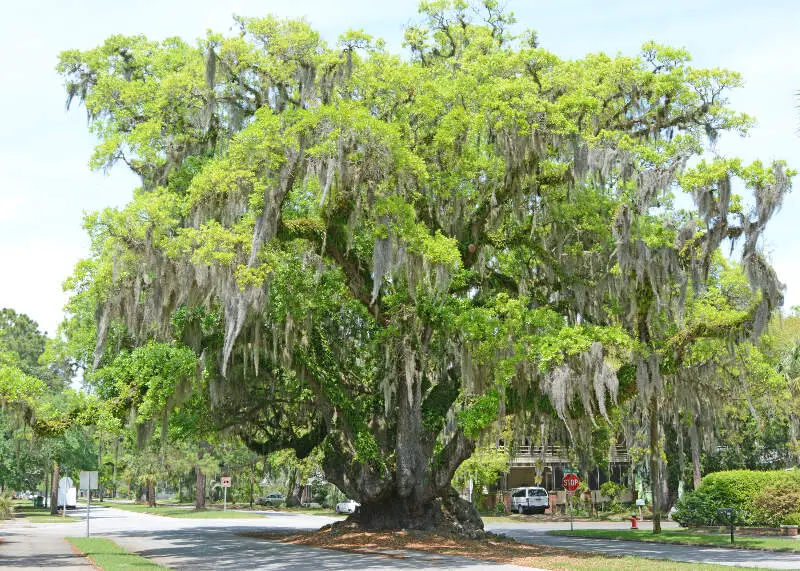
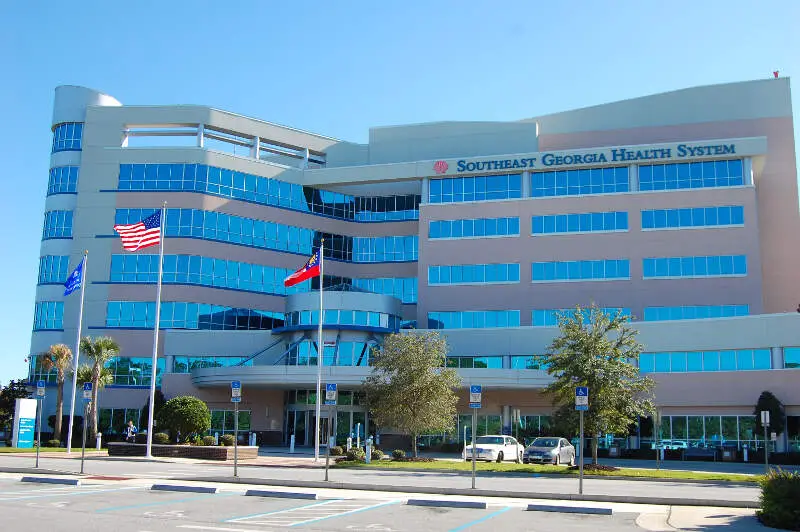
Brunswick, GA Photos


Rankings & Articles For Brunswick


Locations Around Brunswick
Map Of Brunswick, GA
Best Places Around Brunswick
Yulee, FL
Population 16,648
St. Marys, GA
Population 19,166
St. Simons, GA
Population 16,228
Kingsland, GA
Population 19,627
Hinesville, GA
Population 35,679
Country Club Estates, GA
Population 8,780
Fernandina Beach, FL
Population 13,420
Dock Junction, GA
Population 8,147
Jesup, GA
Population 9,942
Brunswick Demographics And Statistics
Population over time in Brunswick
The current population in Brunswick is 15,307. The population has decreased 0.9% from 2010.
| Year | Population | % Change |
|---|---|---|
| 2024 | 15,307 | 0.4% |
| 2023 | 15,248 | 0.0% |
| 2022 | 15,243 | 3.2% |
| 2021 | 14,774 | -9.0% |
| 2020 | 16,231 | 0.7% |
| 2019 | 16,122 | 0.5% |
| 2018 | 16,034 | 0.7% |
| 2017 | 15,919 | -0.5% |
| 2016 | 15,997 | 1.3% |
| 2015 | 15,794 | 0.9% |
| 2014 | 15,648 | 0.5% |
| 2013 | 15,564 | 0.2% |
| 2012 | 15,533 | 0.3% |
| 2011 | 15,482 | 0.2% |
| 2010 | 15,450 | - |
Race / Ethnicity in Brunswick
See the full breakdown
Brunswick is:
29.5% White with 4,510 White residents.
57.7% African American with 8,834 African American residents.
0.0% American Indian with 2 American Indian residents.
0.1% Asian with 15 Asian residents.
0.0% Hawaiian with 0 Hawaiian residents.
0.3% Other with 41 Other residents.
3.2% Two Or More with 484 Two Or More residents.
9.3% Hispanic with 1,421 Hispanic residents.
| Race | Brunswick | GA | USA |
|---|---|---|---|
| White | 29.5% | 49.1% | 57.4% |
| African American | 57.7% | 30.7% | 11.9% |
| American Indian | 0.0% | 0.1% | 0.5% |
| Asian | 0.1% | 4.5% | 5.9% |
| Hawaiian | 0.0% | 0.1% | 0.2% |
| Other | 0.3% | 0.6% | 0.6% |
| Two Or More | 3.2% | 3.9% | 4.3% |
| Hispanic | 9.3% | 11.0% | 19.3% |
Gender in Brunswick
See the full breakdown
Brunswick is 57.2% female with 8,754 female residents.
Brunswick is 42.8% male with 6,553 male residents.
| Gender | Brunswick | GA | USA |
|---|---|---|---|
| Female | 57.2% | 51.2% | 50.5% |
| Male | 42.8% | 48.8% | 49.5% |
Highest level of educational attainment in Brunswick for adults over 25
See the full breakdown
5.0% of adults in Brunswick completed < 9th grade.
9.0% of adults in Brunswick completed 9-12th grade.
41.0% of adults in Brunswick completed high school / ged.
17.0% of adults in Brunswick completed some college.
8.0% of adults in Brunswick completed associate's degree.
12.0% of adults in Brunswick completed bachelor's degree.
5.0% of adults in Brunswick completed master's degree.
2.0% of adults in Brunswick completed professional degree.
1.0% of adults in Brunswick completed doctorate degree.
| Education | Brunswick | GA | USA |
|---|---|---|---|
| < 9th Grade | 5.0% | 4.0% | 4.0% |
| 9-12th Grade | 9.0% | 7.0% | 6.0% |
| High School / GED | 41.0% | 27.0% | 26.0% |
| Some College | 17.0% | 19.0% | 19.0% |
| Associate's Degree | 8.0% | 8.0% | 9.0% |
| Bachelor's Degree | 12.0% | 21.0% | 22.0% |
| Master's Degree | 5.0% | 10.0% | 10.0% |
| Professional Degree | 2.0% | 2.0% | 2.0% |
| Doctorate Degree | 1.0% | 2.0% | 2.0% |
Household Income For Brunswick, Georgia
See the full breakdown
12.9% of households in Brunswick earn Less than $10,000.
5.8% of households in Brunswick earn $10,000 to $14,999.
16.5% of households in Brunswick earn $15,000 to $24,999.
10.9% of households in Brunswick earn $25,000 to $34,999.
15.7% of households in Brunswick earn $35,000 to $49,999.
17.5% of households in Brunswick earn $50,000 to $74,999.
8.3% of households in Brunswick earn $75,000 to $99,999.
7.4% of households in Brunswick earn $100,000 to $149,999.
2.6% of households in Brunswick earn $150,000 to $199,999.
2.5% of households in Brunswick earn $200,000 or more.
| Income | Brunswick | GA | USA |
|---|---|---|---|
| Less than $10,000 | 12.9% | 5.4% | 5.0% |
| $10,000 to $14,999 | 5.8% | 3.4% | 3.4% |
| $15,000 to $24,999 | 16.5% | 6.6% | 6.3% |
| $25,000 to $34,999 | 10.9% | 6.8% | 6.6% |
| $35,000 to $49,999 | 15.7% | 10.7% | 10.1% |
| $50,000 to $74,999 | 17.5% | 15.9% | 15.5% |
| $75,000 to $99,999 | 8.3% | 13.0% | 12.6% |
| $100,000 to $149,999 | 7.4% | 17.3% | 17.5% |
| $150,000 to $199,999 | 2.6% | 9.2% | 9.6% |
| $200,000 or more | 2.5% | 11.9% | 13.4% |
Source: U.S. Census ACS 5-year estimates (2024)


