Forest Park SnackAbility
Overall SnackAbility
Crime in Forest Park summary. We use data from the FBI to determine the crime rates in Forest Park. Key points include:
There were 661 total crimes in Forest Park in the last reporting year.
The overall crime rate per 100,000 people in Forest Park is 3,437.0 / 100k people.
The violent crime rate per 100,000 people in Forest Park is 572.0 / 100k people.
The property crime rate per 100,000 people in Forest Park is 2,865.0 / 100k people.
Overall, crime in Forest Park is 62.18% above the national average.
Total Crimes
Above National Average
Crime In Forest Park Comparison Table
| Statistic | Count Raw |
Forest Park / 100k People |
Georgia / 100k People |
National / 100k People |
|---|---|---|---|---|
| Total Crimes Per 100K | 661 | 3,437.0 | 2,000.6 | 2,119.2 |
| Violent Crime | 110 | 572.0 | 325.7 | 359.0 |
| Murder | 6 | 31.2 | 6.9 | 5.0 |
| Robbery | 21 | 109.2 | 40.8 | 61.0 |
| Aggravated Assault | 79 | 410.8 | 245.9 | 256.0 |
| Property Crime | 551 | 2,865.0 | 1,674.9 | 1,760.0 |
| Burglary | 71 | 369.2 | 202.8 | 229.0 |
| Larceny | 368 | 1,913.5 | 1,247.3 | 1,272.0 |
| Car Theft | 112 | 582.4 | 224.7 | 259.0 |
Source: FBI Uniform Crime Reporting (2024)
Cost of living in Forest Park summary. We use data on the cost of living to determine how expensive it is to live in Forest Park. Real estate prices drive most of the variance in cost of living around Georgia. Key points include:
The cost of living in Forest Park is 89 with 100 being average.
The cost of living in Forest Park is 0.9x lower than the national average.
The median home value in Forest Park is $165,626.
The median income in Forest Park is $41,211.
Forest Park's Overall Cost Of Living
Lower Than The National Average
Cost Of Living In Forest Park Comparison Table
| Living Expense | Forest Park | Georgia | National Average |
|---|---|---|---|
| Overall | 89 | 95 | 100 |
| Services | 101 | 97 | 100 |
| Groceries | 98 | 99 | 100 |
| Health | 58 | 88 | 100 |
| Housing | 100 | 101 | 100 |
| Transportation | 98 | 104 | 100 |
| Utilities | 99 | 101 | 100 |
Source: Cost of living index, normalized to US average = 100
Forest Park, GA Weather
The average high in Forest Park is 71.8° and the average low is 51.3°.
There are 80.5 days of precipitation each year.
Expect an average of 49.8 inches of precipitation each year with 1.8 inches of snow.
| Stat | Forest Park |
|---|---|
| Average Annual High | 71.8 |
| Average Annual Low | 51.3 |
| Annual Precipitation Days | 80.5 |
| Average Annual Precipitation | 49.8 |
| Average Annual Snowfall | 1.8 |
Average High
Days of Rain
Source: NOAA climate normals (30-year)
Forest Park, GA Photos


1 Reviews & Comments About Forest Park

I live in Forest Park and know enough not to mix up the southern part of the Atlanta MSA with Chesapeake Bay.
This little burg has its issues, but what town doesnt- Its the last place in metro Atlanta with affordable housing. We elected our first African-American mayor. And the citys diverse population finally has a voice in its own governance.
Rankings & Articles For Forest Park


Locations Around Forest Park
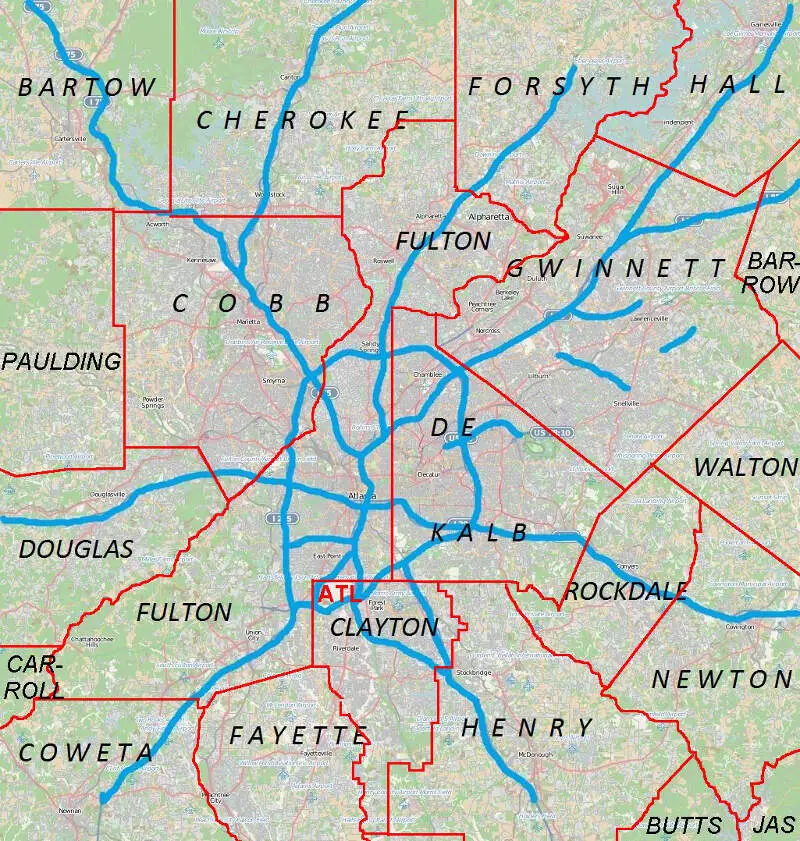
Map Of Forest Park, GA
Best Places Around Forest Park
Decatur, GA
Population 24,518
Druid Hills, GA
Population 8,169
North Decatur, GA
Population 18,442
Smyrna, GA
Population 56,633
Fayetteville, GA
Population 19,719
Tyrone, GA
Population 7,896
North Druid Hills, GA
Population 17,997
Chamblee, GA
Population 30,895
Forest Park Demographics And Statistics
Population over time in Forest Park
The current population in Forest Park is 19,504. The population has increased 0.9% from 2010.
| Year | Population | % Change |
|---|---|---|
| 2024 | 19,504 | -0.6% |
| 2023 | 19,619 | 0.0% |
| 2022 | 19,619 | -1.2% |
| 2021 | 19,856 | -0.1% |
| 2020 | 19,884 | 0.8% |
| 2019 | 19,723 | 1.2% |
| 2018 | 19,483 | 1.1% |
| 2017 | 19,271 | 0.6% |
| 2016 | 19,156 | 1.1% |
| 2015 | 18,953 | 0.9% |
| 2014 | 18,783 | 0.3% |
| 2013 | 18,731 | -0.7% |
| 2012 | 18,856 | -1.0% |
| 2011 | 19,048 | -1.4% |
| 2010 | 19,322 | - |
Race / Ethnicity in Forest Park
See the full breakdown
Forest Park is:
12.9% White with 2,517 White residents.
49.5% African American with 9,655 African American residents.
0.2% American Indian with 45 American Indian residents.
4.7% Asian with 910 Asian residents.
0.0% Hawaiian with 0 Hawaiian residents.
1.3% Other with 244 Other residents.
4.0% Two Or More with 779 Two Or More residents.
27.5% Hispanic with 5,354 Hispanic residents.
| Race | Forest Park | GA | USA |
|---|---|---|---|
| White | 12.9% | 49.1% | 57.4% |
| African American | 49.5% | 30.7% | 11.9% |
| American Indian | 0.2% | 0.1% | 0.5% |
| Asian | 4.7% | 4.5% | 5.9% |
| Hawaiian | 0.0% | 0.1% | 0.2% |
| Other | 1.3% | 0.6% | 0.6% |
| Two Or More | 4.0% | 3.9% | 4.3% |
| Hispanic | 27.5% | 11.0% | 19.3% |
Gender in Forest Park
See the full breakdown
Forest Park is 47.5% female with 9,268 female residents.
Forest Park is 52.5% male with 10,236 male residents.
| Gender | Forest Park | GA | USA |
|---|---|---|---|
| Female | 47.5% | 51.2% | 50.5% |
| Male | 52.5% | 48.8% | 49.5% |
Highest level of educational attainment in Forest Park for adults over 25
See the full breakdown
11.0% of adults in Forest Park completed < 9th grade.
14.0% of adults in Forest Park completed 9-12th grade.
36.0% of adults in Forest Park completed high school / ged.
19.0% of adults in Forest Park completed some college.
8.0% of adults in Forest Park completed associate's degree.
10.0% of adults in Forest Park completed bachelor's degree.
2.0% of adults in Forest Park completed master's degree.
0.0% of adults in Forest Park completed professional degree.
0.0% of adults in Forest Park completed doctorate degree.
| Education | Forest Park | GA | USA |
|---|---|---|---|
| < 9th Grade | 11.0% | 4.0% | 4.0% |
| 9-12th Grade | 14.0% | 7.0% | 6.0% |
| High School / GED | 36.0% | 27.0% | 26.0% |
| Some College | 19.0% | 19.0% | 19.0% |
| Associate's Degree | 8.0% | 8.0% | 9.0% |
| Bachelor's Degree | 10.0% | 21.0% | 22.0% |
| Master's Degree | 2.0% | 10.0% | 10.0% |
| Professional Degree | 0.0% | 2.0% | 2.0% |
| Doctorate Degree | 0.0% | 2.0% | 2.0% |
Household Income For Forest Park, Georgia
See the full breakdown
8.1% of households in Forest Park earn Less than $10,000.
5.4% of households in Forest Park earn $10,000 to $14,999.
9.6% of households in Forest Park earn $15,000 to $24,999.
11.7% of households in Forest Park earn $25,000 to $34,999.
26.3% of households in Forest Park earn $35,000 to $49,999.
16.6% of households in Forest Park earn $50,000 to $74,999.
8.2% of households in Forest Park earn $75,000 to $99,999.
10.0% of households in Forest Park earn $100,000 to $149,999.
1.1% of households in Forest Park earn $150,000 to $199,999.
2.9% of households in Forest Park earn $200,000 or more.
| Income | Forest Park | GA | USA |
|---|---|---|---|
| Less than $10,000 | 8.1% | 5.4% | 5.0% |
| $10,000 to $14,999 | 5.4% | 3.4% | 3.4% |
| $15,000 to $24,999 | 9.6% | 6.6% | 6.3% |
| $25,000 to $34,999 | 11.7% | 6.8% | 6.6% |
| $35,000 to $49,999 | 26.3% | 10.7% | 10.1% |
| $50,000 to $74,999 | 16.6% | 15.9% | 15.5% |
| $75,000 to $99,999 | 8.2% | 13.0% | 12.6% |
| $100,000 to $149,999 | 10.0% | 17.3% | 17.5% |
| $150,000 to $199,999 | 1.1% | 9.2% | 9.6% |
| $200,000 or more | 2.9% | 11.9% | 13.4% |
Source: U.S. Census ACS 5-year estimates (2024)


