Jefferson SnackAbility
Overall SnackAbility
Crime in Jefferson summary. We use data from the FBI to determine the crime rates in Jefferson. Key points include:
There were 82 total crimes in Jefferson in the last reporting year.
The overall crime rate per 100,000 people in Jefferson is 492.7 / 100k people.
The violent crime rate per 100,000 people in Jefferson is 36.1 / 100k people.
The property crime rate per 100,000 people in Jefferson is 456.6 / 100k people.
Overall, crime in Jefferson is -76.75% below the national average.
Total Crimes
Below National Average
Crime In Jefferson Comparison Table
| Statistic | Count Raw |
Jefferson / 100k People |
Georgia / 100k People |
National / 100k People |
|---|---|---|---|---|
| Total Crimes Per 100K | 82 | 492.7 | 2,000.6 | 2,119.2 |
| Violent Crime | 6 | 36.1 | 325.7 | 359.0 |
| Murder | 0 | 0.0 | 6.9 | 5.0 |
| Robbery | 0 | 0.0 | 40.8 | 61.0 |
| Aggravated Assault | 3 | 18.0 | 245.9 | 256.0 |
| Property Crime | 76 | 456.6 | 1,674.9 | 1,760.0 |
| Burglary | 6 | 36.1 | 202.8 | 229.0 |
| Larceny | 65 | 390.6 | 1,247.3 | 1,272.0 |
| Car Theft | 5 | 30.0 | 224.7 | 259.0 |
Source: FBI Uniform Crime Reporting (2024)
Cost of living in Jefferson summary. We use data on the cost of living to determine how expensive it is to live in Jefferson. Real estate prices drive most of the variance in cost of living around Georgia. Key points include:
The cost of living in Jefferson is 106 with 100 being average.
The cost of living in Jefferson is 1.1x higher than the national average.
The median home value in Jefferson is $416,352.
The median income in Jefferson is $109,828.
Jefferson's Overall Cost Of Living
Higher Than The National Average
Cost Of Living In Jefferson Comparison Table
| Living Expense | Jefferson | Georgia | National Average |
|---|---|---|---|
| Overall | 106 | 95 | 100 |
| Services | 101 | 97 | 100 |
| Groceries | 101 | 99 | 100 |
| Health | 113 | 88 | 100 |
| Housing | 101 | 101 | 100 |
| Transportation | 106 | 104 | 100 |
| Utilities | 111 | 101 | 100 |
Source: Cost of living index, normalized to US average = 100
Jefferson, GA Weather
The average high in Jefferson is 72.4° and the average low is 50.5°.
There are 91.0 days of precipitation each year.
Expect an average of 50.4 inches of precipitation each year with 0.8 inches of snow.
| Stat | Jefferson |
|---|---|
| Average Annual High | 72.4 |
| Average Annual Low | 50.5 |
| Annual Precipitation Days | 91.0 |
| Average Annual Precipitation | 50.4 |
| Average Annual Snowfall | 0.8 |
Average High
Days of Rain
Source: NOAA climate normals (30-year)
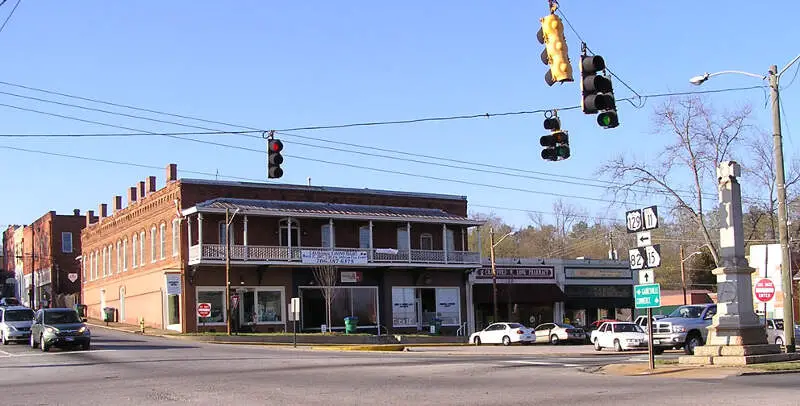
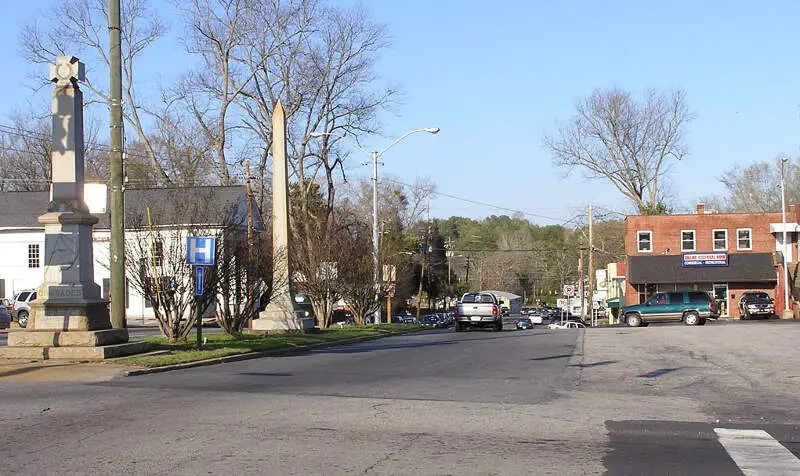
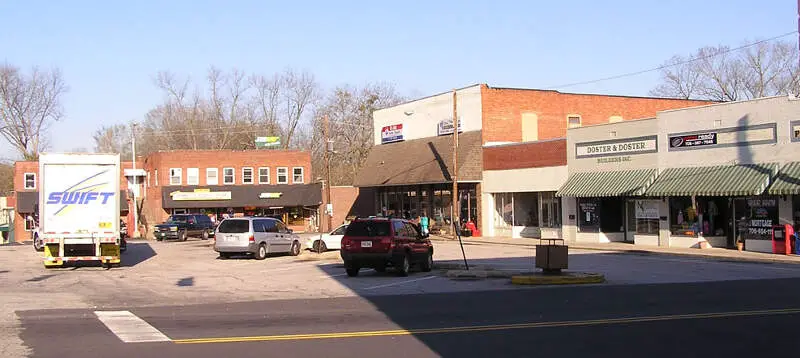
Jefferson, GA Photos
1 Reviews & Comments About Jefferson

My grandparents used to live here and it has a lot of nostalgic value. It is a quaint little Southern town where everything seems to move at a slower place. It's a great place to go and relax.
The town square is very nice to walk around. Also, visit the Crawford W. Long Museum!
Rankings & Articles For Jefferson


Locations Around Jefferson
Map Of Jefferson, GA
Best Places Around Jefferson
Flowery Branch, GA
Population 10,925
Braselton, GA
Population 15,178
Auburn, GA
Population 8,711
Commerce, GA
Population 8,013
Gainesville, GA
Population 45,032
Winder, GA
Population 19,437
Jefferson Demographics And Statistics
Population over time in Jefferson
The current population in Jefferson is 14,990. The population has increased 74.6% from 2010.
| Year | Population | % Change |
|---|---|---|
| 2024 | 14,990 | 5.2% |
| 2023 | 14,249 | 5.6% |
| 2022 | 13,496 | 6.0% |
| 2021 | 12,727 | 9.5% |
| 2020 | 11,619 | 4.5% |
| 2019 | 11,114 | 3.9% |
| 2018 | 10,693 | 4.2% |
| 2017 | 10,259 | 3.1% |
| 2016 | 9,946 | 1.8% |
| 2015 | 9,771 | 1.5% |
| 2014 | 9,630 | 1.3% |
| 2013 | 9,503 | 2.2% |
| 2012 | 9,296 | 3.0% |
| 2011 | 9,021 | 5.1% |
| 2010 | 8,587 | - |
Race / Ethnicity in Jefferson
See the full breakdown
Jefferson is:
74.8% White with 11,217 White residents.
9.7% African American with 1,459 African American residents.
0.0% American Indian with 0 American Indian residents.
2.1% Asian with 310 Asian residents.
0.0% Hawaiian with 0 Hawaiian residents.
0.6% Other with 86 Other residents.
2.6% Two Or More with 388 Two Or More residents.
10.2% Hispanic with 1,530 Hispanic residents.
| Race | Jefferson | GA | USA |
|---|---|---|---|
| White | 74.8% | 49.1% | 57.4% |
| African American | 9.7% | 30.7% | 11.9% |
| American Indian | 0.0% | 0.1% | 0.5% |
| Asian | 2.1% | 4.5% | 5.9% |
| Hawaiian | 0.0% | 0.1% | 0.2% |
| Other | 0.6% | 0.6% | 0.6% |
| Two Or More | 2.6% | 3.9% | 4.3% |
| Hispanic | 10.2% | 11.0% | 19.3% |
Gender in Jefferson
See the full breakdown
Jefferson is 48.5% female with 7,275 female residents.
Jefferson is 51.5% male with 7,714 male residents.
| Gender | Jefferson | GA | USA |
|---|---|---|---|
| Female | 48.5% | 51.2% | 50.5% |
| Male | 51.5% | 48.8% | 49.5% |
Highest level of educational attainment in Jefferson for adults over 25
See the full breakdown
3.0% of adults in Jefferson completed < 9th grade.
7.0% of adults in Jefferson completed 9-12th grade.
30.0% of adults in Jefferson completed high school / ged.
17.0% of adults in Jefferson completed some college.
9.0% of adults in Jefferson completed associate's degree.
21.0% of adults in Jefferson completed bachelor's degree.
10.0% of adults in Jefferson completed master's degree.
2.0% of adults in Jefferson completed professional degree.
1.0% of adults in Jefferson completed doctorate degree.
| Education | Jefferson | GA | USA |
|---|---|---|---|
| < 9th Grade | 3.0% | 4.0% | 4.0% |
| 9-12th Grade | 7.0% | 7.0% | 6.0% |
| High School / GED | 30.0% | 27.0% | 26.0% |
| Some College | 17.0% | 19.0% | 19.0% |
| Associate's Degree | 9.0% | 8.0% | 9.0% |
| Bachelor's Degree | 21.0% | 21.0% | 22.0% |
| Master's Degree | 10.0% | 10.0% | 10.0% |
| Professional Degree | 2.0% | 2.0% | 2.0% |
| Doctorate Degree | 1.0% | 2.0% | 2.0% |
Household Income For Jefferson, Georgia
See the full breakdown
1.4% of households in Jefferson earn Less than $10,000.
3.3% of households in Jefferson earn $10,000 to $14,999.
3.6% of households in Jefferson earn $15,000 to $24,999.
5.5% of households in Jefferson earn $25,000 to $34,999.
6.9% of households in Jefferson earn $35,000 to $49,999.
13.8% of households in Jefferson earn $50,000 to $74,999.
13.4% of households in Jefferson earn $75,000 to $99,999.
20.9% of households in Jefferson earn $100,000 to $149,999.
15.2% of households in Jefferson earn $150,000 to $199,999.
16.0% of households in Jefferson earn $200,000 or more.
| Income | Jefferson | GA | USA |
|---|---|---|---|
| Less than $10,000 | 1.4% | 5.4% | 5.0% |
| $10,000 to $14,999 | 3.3% | 3.4% | 3.4% |
| $15,000 to $24,999 | 3.6% | 6.6% | 6.3% |
| $25,000 to $34,999 | 5.5% | 6.8% | 6.6% |
| $35,000 to $49,999 | 6.9% | 10.7% | 10.1% |
| $50,000 to $74,999 | 13.8% | 15.9% | 15.5% |
| $75,000 to $99,999 | 13.4% | 13.0% | 12.6% |
| $100,000 to $149,999 | 20.9% | 17.3% | 17.5% |
| $150,000 to $199,999 | 15.2% | 9.2% | 9.6% |
| $200,000 or more | 16.0% | 11.9% | 13.4% |
Source: U.S. Census ACS 5-year estimates (2024)


