Senoia SnackAbility
Overall SnackAbility
Senoia, GA Weather
The average high in Senoia is 72.6° and the average low is 50.0°.
There are 75.4 days of precipitation each year.
Expect an average of 49.4 inches of precipitation each year with 1.1 inches of snow.
| Stat | Senoia |
|---|---|
| Average Annual High | 72.6 |
| Average Annual Low | 50.0 |
| Annual Precipitation Days | 75.4 |
| Average Annual Precipitation | 49.4 |
| Average Annual Snowfall | 1.1 |
Average High
Days of Rain
Source: NOAA climate normals (30-year)
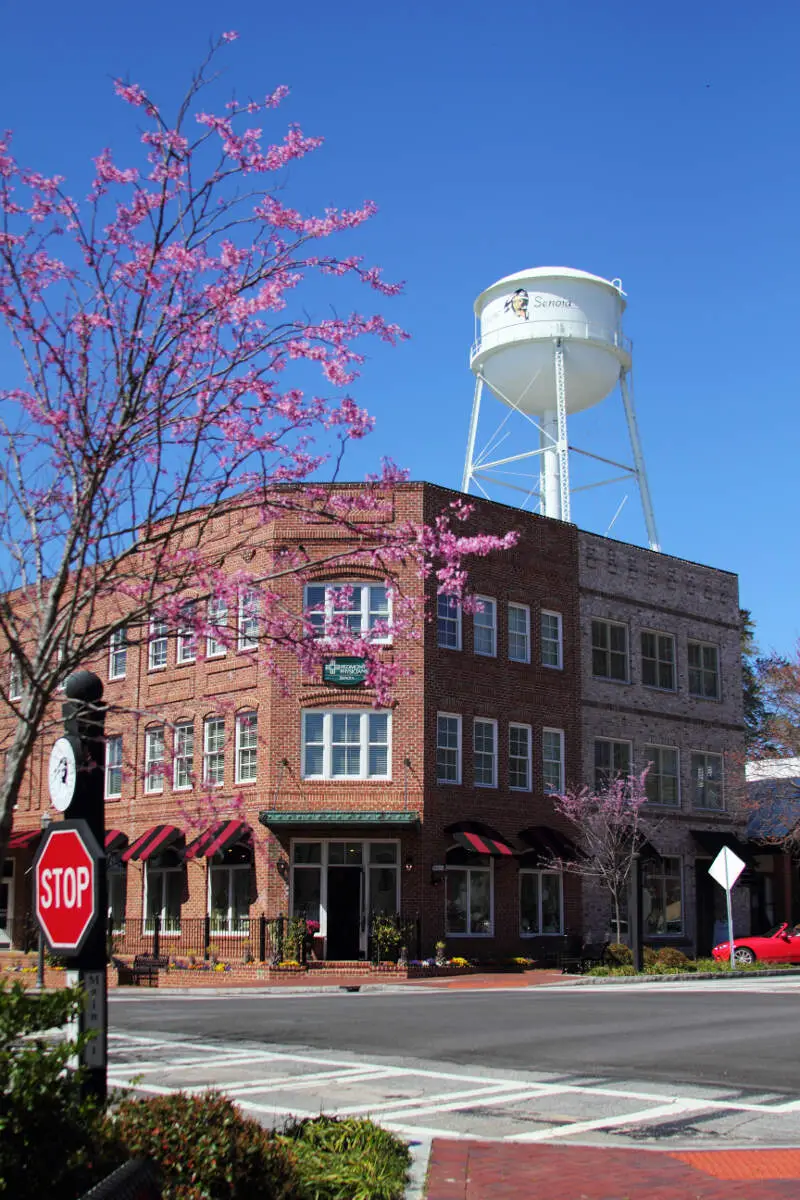
Senoia, GA Photos
Rankings & Articles For Senoia


Locations Around Senoia
Map Of Senoia, GA
Best Places Around Senoia
Fayetteville, GA
Population 19,719
Tyrone, GA
Population 7,896
Hampton, GA
Population 8,687
Newnan, GA
Population 44,235
Irondale, GA
Population 9,185
Fairburn, GA
Population 16,831
Riverdale, GA
Population 14,792
Griffin, GA
Population 23,761
Lovejoy, GA
Population 11,508
Senoia Demographics And Statistics
Population over time in Senoia
The current population in Senoia is 5,589. The population has increased 82.5% from 2010.
| Year | Population | % Change |
|---|---|---|
| 2024 | 5,589 | 4.4% |
| 2023 | 5,353 | 4.7% |
| 2022 | 5,115 | 5.2% |
| 2021 | 4,862 | 10.9% |
| 2020 | 4,386 | 3.1% |
| 2019 | 4,256 | 2.3% |
| 2018 | 4,160 | 3.3% |
| 2017 | 4,027 | 3.5% |
| 2016 | 3,889 | 3.1% |
| 2015 | 3,773 | 4.0% |
| 2014 | 3,627 | 4.3% |
| 2013 | 3,479 | 4.1% |
| 2012 | 3,343 | 5.3% |
| 2011 | 3,174 | 3.7% |
| 2010 | 3,062 | - |
Race / Ethnicity in Senoia
See the full breakdown
Senoia is:
74.2% White with 4,149 White residents.
16.6% African American with 927 African American residents.
0.0% American Indian with 0 American Indian residents.
0.0% Asian with 0 Asian residents.
0.0% Hawaiian with 0 Hawaiian residents.
0.0% Other with 0 Other residents.
4.9% Two Or More with 276 Two Or More residents.
4.2% Hispanic with 237 Hispanic residents.
| Race | Senoia | GA | USA |
|---|---|---|---|
| White | 74.2% | 49.1% | 57.4% |
| African American | 16.6% | 30.7% | 11.9% |
| American Indian | 0.0% | 0.1% | 0.5% |
| Asian | 0.0% | 4.5% | 5.9% |
| Hawaiian | 0.0% | 0.1% | 0.2% |
| Other | 0.0% | 0.6% | 0.6% |
| Two Or More | 4.9% | 3.9% | 4.3% |
| Hispanic | 4.2% | 11.0% | 19.3% |
Gender in Senoia
See the full breakdown
Senoia is 51.4% female with 2,873 female residents.
Senoia is 48.6% male with 2,716 male residents.
| Gender | Senoia | GA | USA |
|---|---|---|---|
| Female | 51.4% | 51.2% | 50.5% |
| Male | 48.6% | 48.8% | 49.5% |
Highest level of educational attainment in Senoia for adults over 25
See the full breakdown
1.0% of adults in Senoia completed < 9th grade.
4.0% of adults in Senoia completed 9-12th grade.
16.0% of adults in Senoia completed high school / ged.
24.0% of adults in Senoia completed some college.
9.0% of adults in Senoia completed associate's degree.
30.0% of adults in Senoia completed bachelor's degree.
11.0% of adults in Senoia completed master's degree.
3.0% of adults in Senoia completed professional degree.
2.0% of adults in Senoia completed doctorate degree.
| Education | Senoia | GA | USA |
|---|---|---|---|
| < 9th Grade | 1.0% | 4.0% | 4.0% |
| 9-12th Grade | 4.0% | 7.0% | 6.0% |
| High School / GED | 16.0% | 27.0% | 26.0% |
| Some College | 24.0% | 19.0% | 19.0% |
| Associate's Degree | 9.0% | 8.0% | 9.0% |
| Bachelor's Degree | 30.0% | 21.0% | 22.0% |
| Master's Degree | 11.0% | 10.0% | 10.0% |
| Professional Degree | 3.0% | 2.0% | 2.0% |
| Doctorate Degree | 2.0% | 2.0% | 2.0% |
Household Income For Senoia, Georgia
See the full breakdown
0.7% of households in Senoia earn Less than $10,000.
0.9% of households in Senoia earn $10,000 to $14,999.
1.5% of households in Senoia earn $15,000 to $24,999.
1.6% of households in Senoia earn $25,000 to $34,999.
9.6% of households in Senoia earn $35,000 to $49,999.
6.3% of households in Senoia earn $50,000 to $74,999.
10.0% of households in Senoia earn $75,000 to $99,999.
36.1% of households in Senoia earn $100,000 to $149,999.
14.6% of households in Senoia earn $150,000 to $199,999.
18.8% of households in Senoia earn $200,000 or more.
| Income | Senoia | GA | USA |
|---|---|---|---|
| Less than $10,000 | 0.7% | 5.4% | 5.0% |
| $10,000 to $14,999 | 0.9% | 3.4% | 3.4% |
| $15,000 to $24,999 | 1.5% | 6.6% | 6.3% |
| $25,000 to $34,999 | 1.6% | 6.8% | 6.6% |
| $35,000 to $49,999 | 9.6% | 10.7% | 10.1% |
| $50,000 to $74,999 | 6.3% | 15.9% | 15.5% |
| $75,000 to $99,999 | 10.0% | 13.0% | 12.6% |
| $100,000 to $149,999 | 36.1% | 17.3% | 17.5% |
| $150,000 to $199,999 | 14.6% | 9.2% | 9.6% |
| $200,000 or more | 18.8% | 11.9% | 13.4% |
Source: U.S. Census ACS 5-year estimates (2024)


