Temple SnackAbility
Overall SnackAbility
Crime in Temple summary. We use data from the FBI to determine the crime rates in Temple. Key points include:
There were 71 total crimes in Temple in the last reporting year.
The overall crime rate per 100,000 people in Temple is 1,038.6 / 100k people.
The violent crime rate per 100,000 people in Temple is 58.5 / 100k people.
The property crime rate per 100,000 people in Temple is 980.1 / 100k people.
Overall, crime in Temple is -50.99% below the national average.
Total Crimes
Below National Average
Crime In Temple Comparison Table
| Statistic | Count Raw |
Temple / 100k People |
Georgia / 100k People |
National / 100k People |
|---|---|---|---|---|
| Total Crimes Per 100K | 71 | 1,038.6 | 2,000.6 | 2,119.2 |
| Violent Crime | 4 | 58.5 | 325.7 | 359.0 |
| Murder | 0 | 0.0 | 6.9 | 5.0 |
| Robbery | 0 | 0.0 | 40.8 | 61.0 |
| Aggravated Assault | 2 | 29.3 | 245.9 | 256.0 |
| Property Crime | 67 | 980.1 | 1,674.9 | 1,760.0 |
| Burglary | 14 | 204.8 | 202.8 | 229.0 |
| Larceny | 43 | 629.0 | 1,247.3 | 1,272.0 |
| Car Theft | 10 | 146.3 | 224.7 | 259.0 |
Source: FBI Uniform Crime Reporting (2024)
Temple, GA Weather
The average high in Temple is 71.0° and the average low is 49.2°.
There are 77.5 days of precipitation each year.
Expect an average of 52.2 inches of precipitation each year with 0.9 inches of snow.
| Stat | Temple |
|---|---|
| Average Annual High | 71.0 |
| Average Annual Low | 49.2 |
| Annual Precipitation Days | 77.5 |
| Average Annual Precipitation | 52.2 |
| Average Annual Snowfall | 0.9 |
Average High
Days of Rain
Source: NOAA climate normals (30-year)
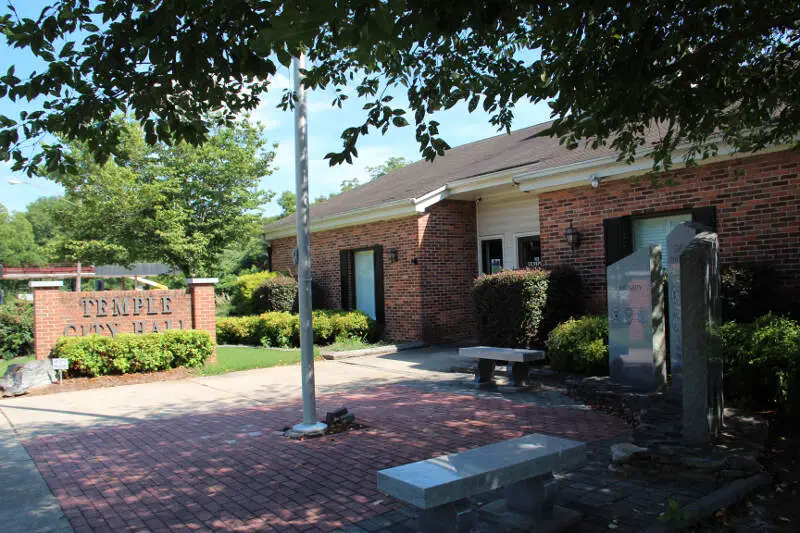
Temple, GA Photos
Rankings & Articles For Temple


Locations Around Temple
Map Of Temple, GA
Best Places Around Temple
La Mirada, CA
Population 47,180
Vincent, CA
Population 15,340
Lakewood, CA
Population 79,850
Cypress, CA
Population 49,498
West Puente Valley, CA
Population 22,495
Citrus, CA
Population 10,904
South Monrovia Island, CA
Population 6,830
La Verne, CA
Population 30,600
La Palma, CA
Population 15,272
Artesia, CA
Population 15,889
Temple Demographics And Statistics
Population over time in Temple
The current population in Temple is 5,901. The population has increased 47.9% from 2010.
| Year | Population | % Change |
|---|---|---|
| 2024 | 5,901 | 4.4% |
| 2023 | 5,655 | 4.8% |
| 2022 | 5,395 | 5.9% |
| 2021 | 5,093 | 8.2% |
| 2020 | 4,709 | 3.5% |
| 2019 | 4,549 | 4.2% |
| 2018 | 4,366 | 0.6% |
| 2017 | 4,338 | 1.2% |
| 2016 | 4,287 | 0.9% |
| 2015 | 4,248 | 0.1% |
| 2014 | 4,244 | 0.3% |
| 2013 | 4,231 | 1.2% |
| 2012 | 4,182 | 2.1% |
| 2011 | 4,097 | 2.7% |
| 2010 | 3,990 | - |
Race / Ethnicity in Temple
See the full breakdown
Temple is:
77.5% White with 4,573 White residents.
15.4% African American with 911 African American residents.
0.0% American Indian with 0 American Indian residents.
1.0% Asian with 59 Asian residents.
0.0% Hawaiian with 0 Hawaiian residents.
0.0% Other with 0 Other residents.
0.7% Two Or More with 43 Two Or More residents.
5.3% Hispanic with 315 Hispanic residents.
| Race | Temple | GA | USA |
|---|---|---|---|
| White | 77.5% | 49.1% | 57.4% |
| African American | 15.4% | 30.7% | 11.9% |
| American Indian | 0.0% | 0.1% | 0.5% |
| Asian | 1.0% | 4.5% | 5.9% |
| Hawaiian | 0.0% | 0.1% | 0.2% |
| Other | 0.0% | 0.6% | 0.6% |
| Two Or More | 0.7% | 3.9% | 4.3% |
| Hispanic | 5.3% | 11.0% | 19.3% |
Gender in Temple
See the full breakdown
Temple is 53.4% female with 3,153 female residents.
Temple is 46.6% male with 2,748 male residents.
| Gender | Temple | GA | USA |
|---|---|---|---|
| Female | 53.4% | 51.2% | 50.5% |
| Male | 46.6% | 48.8% | 49.5% |
Highest level of educational attainment in Temple for adults over 25
See the full breakdown
4.0% of adults in Temple completed < 9th grade.
8.0% of adults in Temple completed 9-12th grade.
42.0% of adults in Temple completed high school / ged.
19.0% of adults in Temple completed some college.
10.0% of adults in Temple completed associate's degree.
9.0% of adults in Temple completed bachelor's degree.
7.0% of adults in Temple completed master's degree.
1.0% of adults in Temple completed professional degree.
0.0% of adults in Temple completed doctorate degree.
| Education | Temple | GA | USA |
|---|---|---|---|
| < 9th Grade | 4.0% | 4.0% | 4.0% |
| 9-12th Grade | 8.0% | 7.0% | 6.0% |
| High School / GED | 42.0% | 27.0% | 26.0% |
| Some College | 19.0% | 19.0% | 19.0% |
| Associate's Degree | 10.0% | 8.0% | 9.0% |
| Bachelor's Degree | 9.0% | 21.0% | 22.0% |
| Master's Degree | 7.0% | 10.0% | 10.0% |
| Professional Degree | 1.0% | 2.0% | 2.0% |
| Doctorate Degree | 0.0% | 2.0% | 2.0% |
Household Income For Temple, Georgia
See the full breakdown
3.7% of households in Temple earn Less than $10,000.
0.0% of households in Temple earn $10,000 to $14,999.
4.3% of households in Temple earn $15,000 to $24,999.
6.5% of households in Temple earn $25,000 to $34,999.
7.6% of households in Temple earn $35,000 to $49,999.
12.9% of households in Temple earn $50,000 to $74,999.
34.9% of households in Temple earn $75,000 to $99,999.
14.5% of households in Temple earn $100,000 to $149,999.
12.1% of households in Temple earn $150,000 to $199,999.
3.4% of households in Temple earn $200,000 or more.
| Income | Temple | GA | USA |
|---|---|---|---|
| Less than $10,000 | 3.7% | 5.4% | 5.0% |
| $10,000 to $14,999 | 0.0% | 3.4% | 3.4% |
| $15,000 to $24,999 | 4.3% | 6.6% | 6.3% |
| $25,000 to $34,999 | 6.5% | 6.8% | 6.6% |
| $35,000 to $49,999 | 7.6% | 10.7% | 10.1% |
| $50,000 to $74,999 | 12.9% | 15.9% | 15.5% |
| $75,000 to $99,999 | 34.9% | 13.0% | 12.6% |
| $100,000 to $149,999 | 14.5% | 17.3% | 17.5% |
| $150,000 to $199,999 | 12.1% | 9.2% | 9.6% |
| $200,000 or more | 3.4% | 11.9% | 13.4% |
Source: U.S. Census ACS 5-year estimates (2024)


