Warner Robins SnackAbility
Overall SnackAbility
Crime in Warner Robins summary. We use data from the FBI to determine the crime rates in Warner Robins. Key points include:
There were 3,132 total crimes in Warner Robins in the last reporting year.
The overall crime rate per 100,000 people in Warner Robins is 3,646.1 / 100k people.
The violent crime rate per 100,000 people in Warner Robins is 665.9 / 100k people.
The property crime rate per 100,000 people in Warner Robins is 2,980.2 / 100k people.
Overall, crime in Warner Robins is 72.05% above the national average.
Total Crimes
Above National Average
Crime In Warner Robins Comparison Table
| Statistic | Count Raw |
Warner Robins / 100k People |
Georgia / 100k People |
National / 100k People |
|---|---|---|---|---|
| Total Crimes Per 100K | 3,132 | 3,646.1 | 2,000.6 | 2,119.2 |
| Violent Crime | 572 | 665.9 | 325.7 | 359.0 |
| Murder | 7 | 8.1 | 6.9 | 5.0 |
| Robbery | 65 | 75.7 | 40.8 | 61.0 |
| Aggravated Assault | 472 | 549.5 | 245.9 | 256.0 |
| Property Crime | 2,560 | 2,980.2 | 1,674.9 | 1,760.0 |
| Burglary | 309 | 359.7 | 202.8 | 229.0 |
| Larceny | 2,043 | 2,378.3 | 1,247.3 | 1,272.0 |
| Car Theft | 208 | 242.1 | 224.7 | 259.0 |
Source: FBI Uniform Crime Reporting (2024)
Cost of living in Warner Robins summary. We use data on the cost of living to determine how expensive it is to live in Warner Robins. Real estate prices drive most of the variance in cost of living around Georgia. Key points include:
The cost of living in Warner Robins is 94 with 100 being average.
The cost of living in Warner Robins is 0.9x lower than the national average.
The median home value in Warner Robins is $212,129.
The median income in Warner Robins is $66,970.
Warner Robins's Overall Cost Of Living
Lower Than The National Average
Cost Of Living In Warner Robins Comparison Table
| Living Expense | Warner Robins | Georgia | National Average |
|---|---|---|---|
| Overall | 94 | 95 | 100 |
| Services | 103 | 97 | 100 |
| Groceries | 101 | 99 | 100 |
| Health | 78 | 88 | 100 |
| Housing | 101 | 101 | 100 |
| Transportation | 98 | 104 | 100 |
| Utilities | 101 | 101 | 100 |
Source: Cost of living index, normalized to US average = 100
Warner Robins, GA Weather
The average high in Warner Robins is 76.1° and the average low is 52.7°.
There are 68.4 days of precipitation each year.
Expect an average of 47.1 inches of precipitation each year with 0.4 inches of snow.
| Stat | Warner Robins |
|---|---|
| Average Annual High | 76.1 |
| Average Annual Low | 52.7 |
| Annual Precipitation Days | 68.4 |
| Average Annual Precipitation | 47.1 |
| Average Annual Snowfall | 0.4 |
Average High
Days of Rain
Source: NOAA climate normals (30-year)
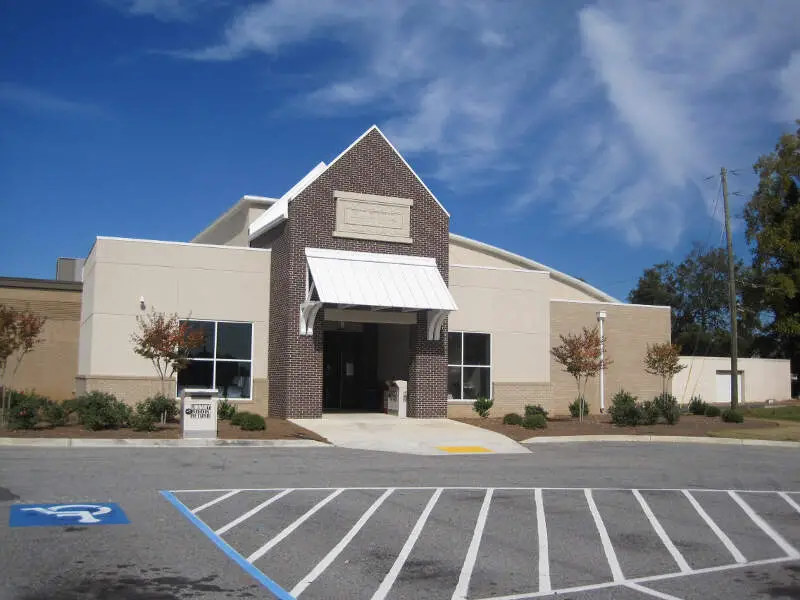
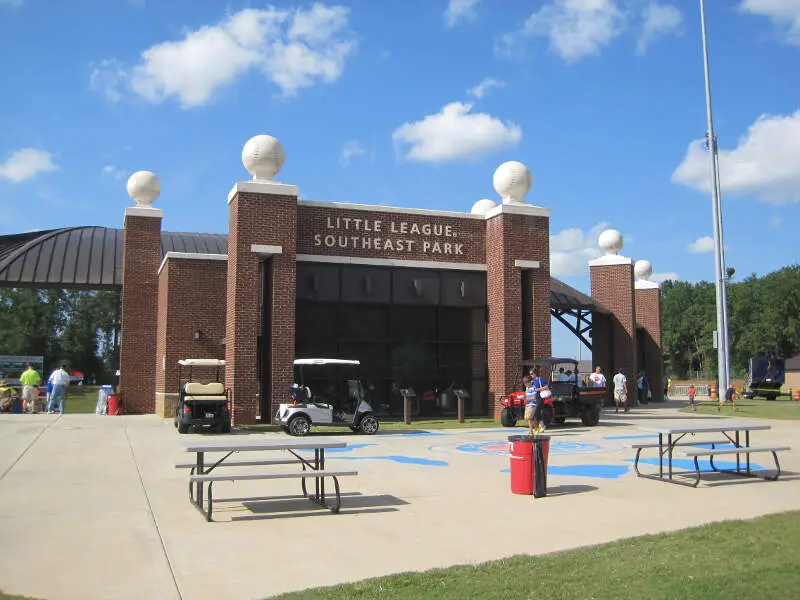
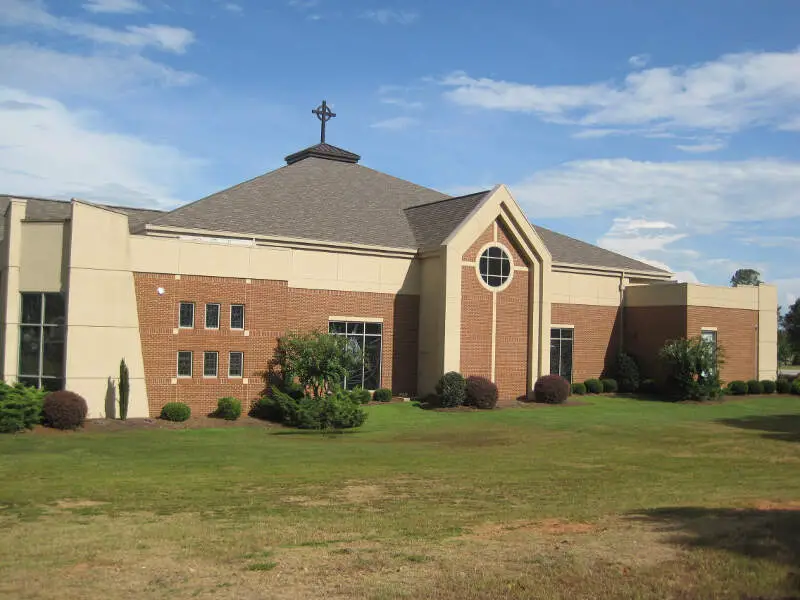
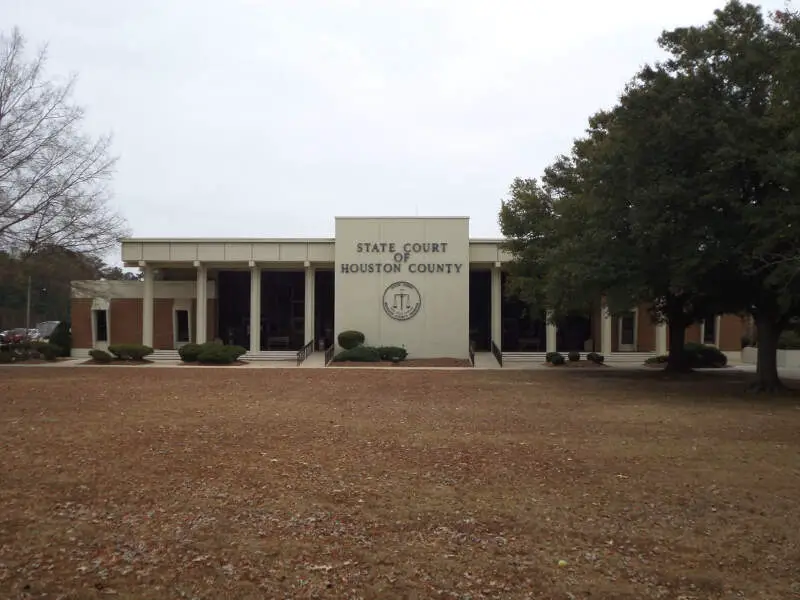
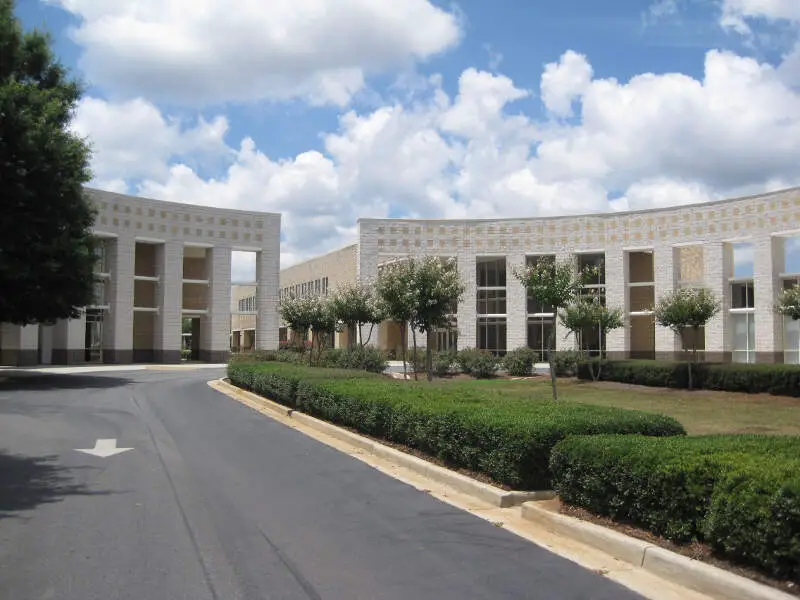
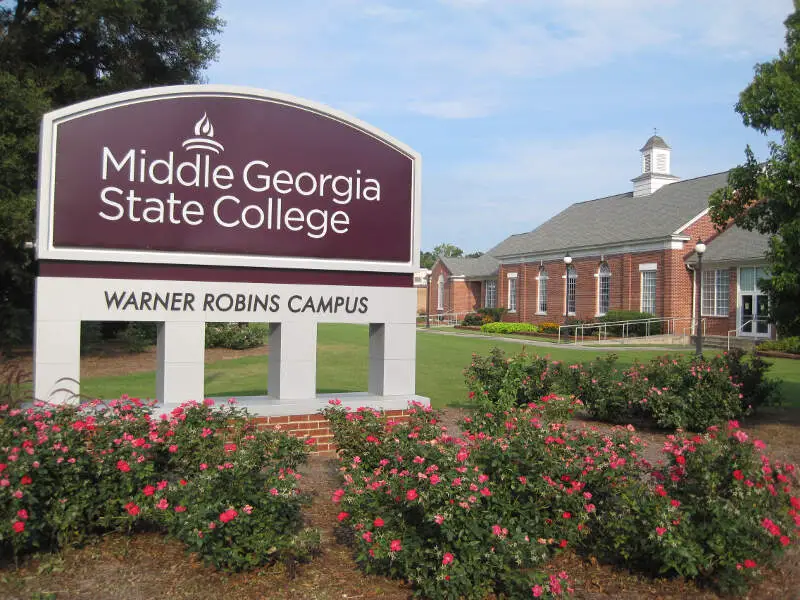
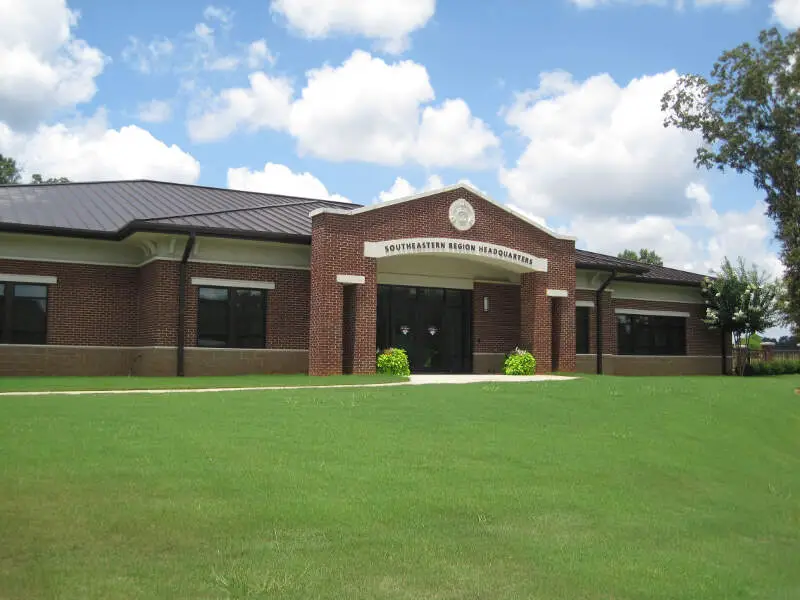
Warner Robins, GA Photos


2 Reviews & Comments About Warner Robins

I went there for a doctor's appointment. To my amazement I have never seen so many different stores in such a short distance on one main road! A shopper's dream!
Any store to shop for clothes and etc. you can think of from A-Z! Restaurants and fast food too!
I don't get it how Warner Robins made it to the cheapest place to live because it isn't, for the crime now that a joke when the Legal Enforcement breaks most of the laws and victims of any crimes are screwed if the offender and their families have a nice checking account. Now we do have good schools especially our high school football teams. Just last year we now have public transportation. For things to do now that is another story cause there really isn't anything to do as a family.
I can't truly say I have a favorite place since I went from Savannah to Germany than Warner Robins and had more stuff stolen from having break-ins and had to deal with the law enforcement and legal authority not doing their job especially when it comes to trying to get a monster off the streets. Warner Robins, no it not cheap nor is it safe.
Rankings & Articles For Warner Robins


Locations Around Warner Robins
Map Of Warner Robins, GA
Best Places Around Warner Robins
Centerville, GA
Population 8,505
Perry, GA
Population 23,001
Milledgeville, GA
Population 16,748
Barnesville, GA
Population 6,121
Cochran, GA
Population 4,803
Knoxville, IA
Population 7,473
Dublin, GA
Population 16,136
Americus, GA
Population 15,813
Warner Robins Demographics And Statistics
Population over time in Warner Robins
The current population in Warner Robins is 82,990. The population has increased 31.2% from 2010.
| Year | Population | % Change |
|---|---|---|
| 2024 | 82,990 | 1.9% |
| 2023 | 81,438 | 1.3% |
| 2022 | 80,374 | 1.0% |
| 2021 | 79,589 | 3.4% |
| 2020 | 76,967 | 1.1% |
| 2019 | 76,115 | 1.8% |
| 2018 | 74,762 | 0.9% |
| 2017 | 74,123 | 1.2% |
| 2016 | 73,265 | 1.0% |
| 2015 | 72,520 | 1.6% |
| 2014 | 71,359 | 2.4% |
| 2013 | 69,695 | 3.5% |
| 2012 | 67,313 | 3.5% |
| 2011 | 65,009 | 2.7% |
| 2010 | 63,271 | - |
Race / Ethnicity in Warner Robins
See the full breakdown
Warner Robins is:
41.5% White with 34,426 White residents.
40.3% African American with 33,480 African American residents.
0.1% American Indian with 51 American Indian residents.
3.4% Asian with 2,818 Asian residents.
0.0% Hawaiian with 26 Hawaiian residents.
0.5% Other with 382 Other residents.
5.4% Two Or More with 4,511 Two Or More residents.
8.8% Hispanic with 7,296 Hispanic residents.
| Race | Warner Robins | GA | USA |
|---|---|---|---|
| White | 41.5% | 49.1% | 57.4% |
| African American | 40.3% | 30.7% | 11.9% |
| American Indian | 0.1% | 0.1% | 0.5% |
| Asian | 3.4% | 4.5% | 5.9% |
| Hawaiian | 0.0% | 0.1% | 0.2% |
| Other | 0.5% | 0.6% | 0.6% |
| Two Or More | 5.4% | 3.9% | 4.3% |
| Hispanic | 8.8% | 11.0% | 19.3% |
Gender in Warner Robins
See the full breakdown
Warner Robins is 51.7% female with 42,914 female residents.
Warner Robins is 48.3% male with 40,076 male residents.
| Gender | Warner Robins | GA | USA |
|---|---|---|---|
| Female | 51.7% | 51.2% | 50.5% |
| Male | 48.3% | 48.8% | 49.5% |
Highest level of educational attainment in Warner Robins for adults over 25
See the full breakdown
3.0% of adults in Warner Robins completed < 9th grade.
4.0% of adults in Warner Robins completed 9-12th grade.
28.0% of adults in Warner Robins completed high school / ged.
23.0% of adults in Warner Robins completed some college.
10.0% of adults in Warner Robins completed associate's degree.
20.0% of adults in Warner Robins completed bachelor's degree.
8.0% of adults in Warner Robins completed master's degree.
2.0% of adults in Warner Robins completed professional degree.
2.0% of adults in Warner Robins completed doctorate degree.
| Education | Warner Robins | GA | USA |
|---|---|---|---|
| < 9th Grade | 3.0% | 4.0% | 4.0% |
| 9-12th Grade | 4.0% | 7.0% | 6.0% |
| High School / GED | 28.0% | 27.0% | 26.0% |
| Some College | 23.0% | 19.0% | 19.0% |
| Associate's Degree | 10.0% | 8.0% | 9.0% |
| Bachelor's Degree | 20.0% | 21.0% | 22.0% |
| Master's Degree | 8.0% | 10.0% | 10.0% |
| Professional Degree | 2.0% | 2.0% | 2.0% |
| Doctorate Degree | 2.0% | 2.0% | 2.0% |
Household Income For Warner Robins, Georgia
See the full breakdown
6.6% of households in Warner Robins earn Less than $10,000.
2.9% of households in Warner Robins earn $10,000 to $14,999.
7.0% of households in Warner Robins earn $15,000 to $24,999.
8.2% of households in Warner Robins earn $25,000 to $34,999.
13.6% of households in Warner Robins earn $35,000 to $49,999.
17.3% of households in Warner Robins earn $50,000 to $74,999.
13.8% of households in Warner Robins earn $75,000 to $99,999.
18.4% of households in Warner Robins earn $100,000 to $149,999.
6.2% of households in Warner Robins earn $150,000 to $199,999.
5.9% of households in Warner Robins earn $200,000 or more.
| Income | Warner Robins | GA | USA |
|---|---|---|---|
| Less than $10,000 | 6.6% | 5.4% | 5.0% |
| $10,000 to $14,999 | 2.9% | 3.4% | 3.4% |
| $15,000 to $24,999 | 7.0% | 6.6% | 6.3% |
| $25,000 to $34,999 | 8.2% | 6.8% | 6.6% |
| $35,000 to $49,999 | 13.6% | 10.7% | 10.1% |
| $50,000 to $74,999 | 17.3% | 15.9% | 15.5% |
| $75,000 to $99,999 | 13.8% | 13.0% | 12.6% |
| $100,000 to $149,999 | 18.4% | 17.3% | 17.5% |
| $150,000 to $199,999 | 6.2% | 9.2% | 9.6% |
| $200,000 or more | 5.9% | 11.9% | 13.4% |
Source: U.S. Census ACS 5-year estimates (2024)


