Gayest places in New Jersey research summary. We used Saturday Night Science to research the cities in New Jersey with the highest percent of same-sex households for 2026. The data comes from the American Community Survey 2020-2024 5-year vintage, which counts same-sex married spouses and same-sex unmarried partners at the city level.
10.8% gay households · #1 gayest in New Jersey
Data | Movers
5.5% gay households · #2 gayest in New Jersey
4.9% gay households · #3 gayest in New Jersey
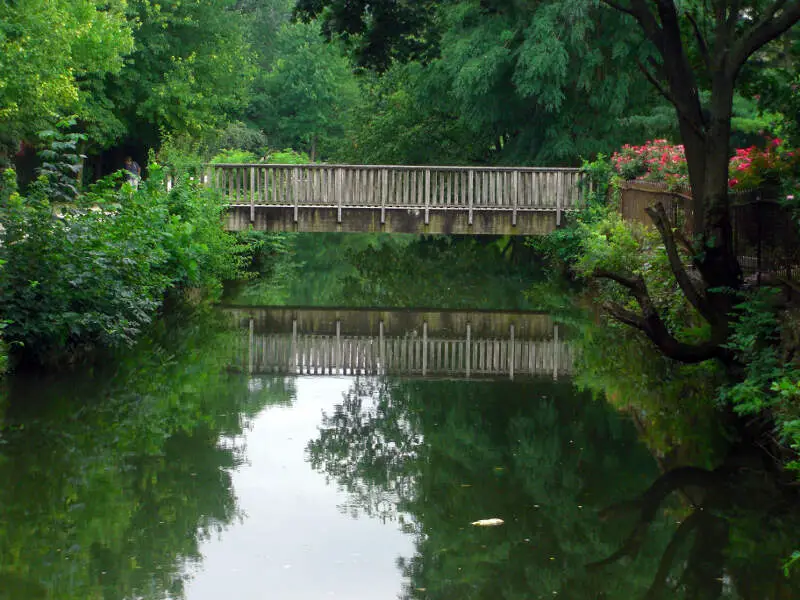
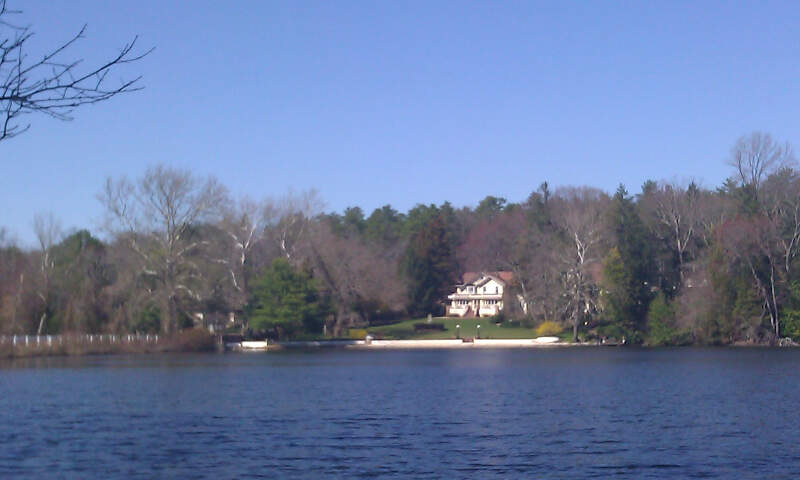
Collingswood is a borough in Camden County, New Jersey, United States, located 6 miles east of Center City, Philadelphia. As of the 2010 United States Census, the borough’s population was 13,926, reflecting a decline of 400 from the 14,326 counted in the 2000 Census, which had in turn declined by 963 from the 15,289 counted in the 1990 Census.
Data | Crime | Cost of living | Movers
4.3% gay households · #4 gayest in New Jersey
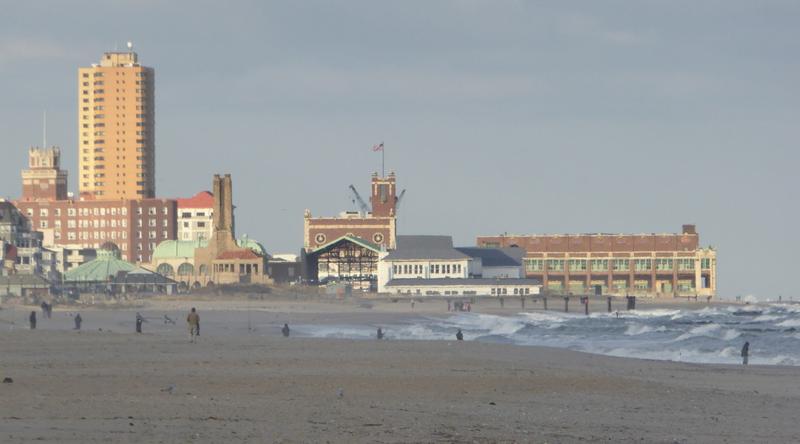
Asbury Park is a city in Monmouth County, New Jersey, United States, located on the Jersey Shore and part of the New York City Metropolitan Area. As of the 2010 United States Census, the city’s population was 16,116, reflecting a decline of 814 from the 16,930 counted in the 2000 Census, which had in turn increased by 131 from the 16,799 counted in the 1990 Census.
Data | Crime | Cost of living | Movers
4.2% gay households · #5 gayest in New Jersey
3.9% gay households · #6 gayest in New Jersey
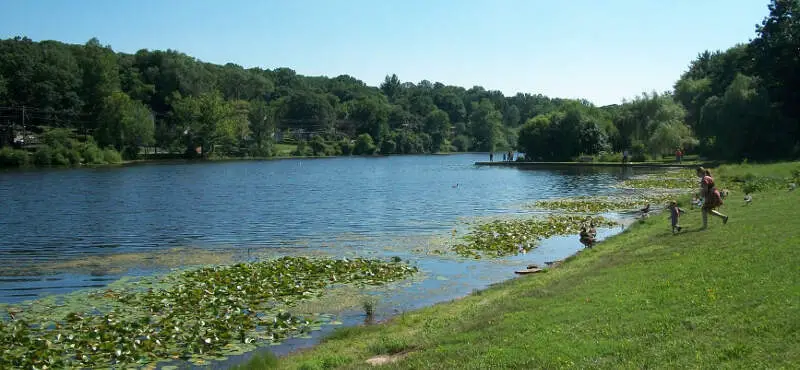
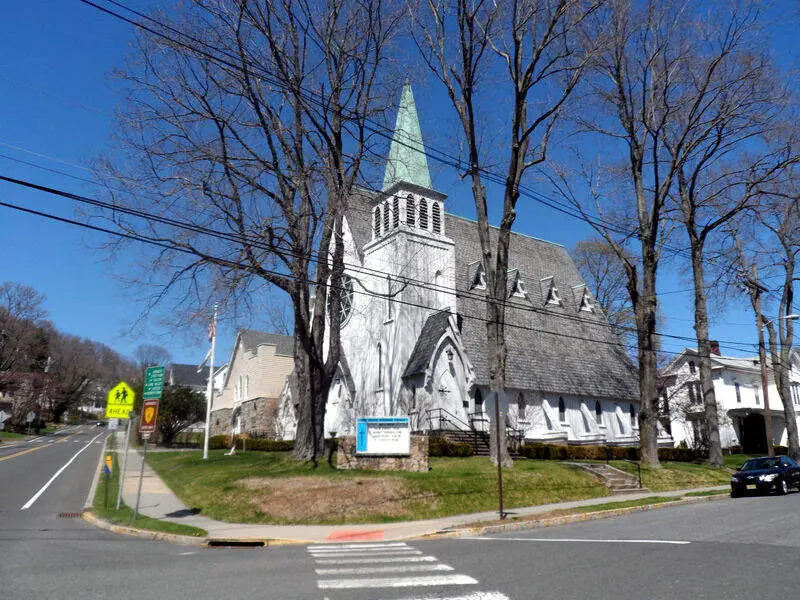
Watchung is a borough in Somerset County, New Jersey, United States. As of the 2010 United States Census, the borough’s population was 5,801, reflecting an increase of 188 from the 5,613 counted in the 2000 Census, which had in turn increased by 503 from the 5,110 counted in the 1990 Census.
Data | Crime | Cost of living | Movers
3.8% gay households · #7 gayest in New Jersey
Data | Movers
3.8% gay households · #8 gayest in New Jersey
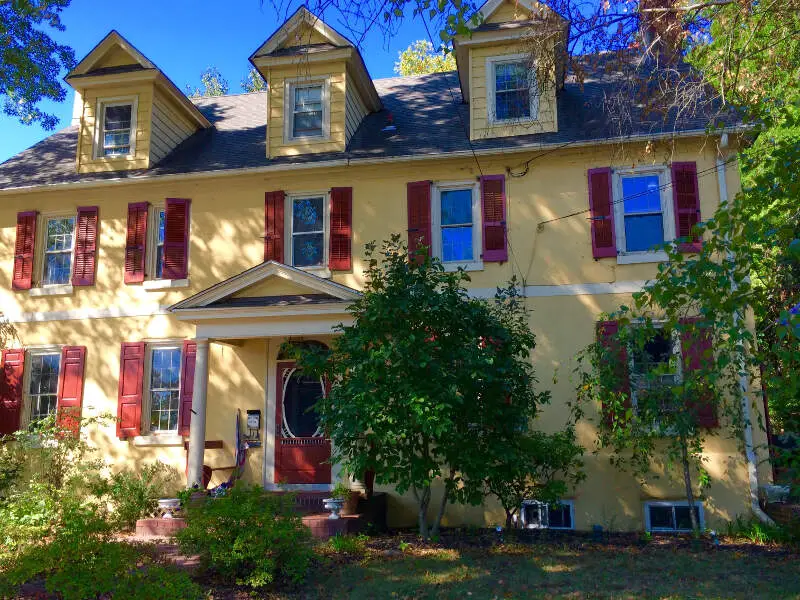
Brookdale is an unincorporated community and census-designated place in Bloomfield, located within Essex County, New Jersey, United States. It is generally considered to be the part of Bloomfield north of Bay Avenue, As of the 2010 United States Census, the CDP’s total population was 9,239.
Data | Crime | Cost of living | Movers
3.8% gay households · #9 gayest in New Jersey
Data | Crime | Cost of living | Movers
3.7% gay households · #10 gayest in New Jersey
Data | Movers
The receipts
Compare the top ten
Pick a metric. The bars rescale. The red line is New Jersey’s statewide median.
On the map
Where New Jersey’s LGBTQ households are
Saturday Night Science
How we determined the gayest places in New Jersey for 2026
In order to rank the gayest cities in New Jersey, we used Saturday Night Science and the 2020-2024 American Community Survey 5-year estimates from the U.S. Census. We looked at:
- Percentage of all households that are unmarried, same-sex partners
We limited the analysis to non-CDPs that have over 1,000 households.
We ranked each place from 1 to 374 with the city containing the highest percentage of unmarried, same-sex partner households being the most gay.
In the end, Ocean Grove ended up being the most gay place with 10.8% gay households.
Skip to the end to see the list of all the places in the state from gayest to straightest.
We updated this report for 2026. This report is our eleventh time ranking the gayest places in New Jersey.
The full plate
Gayest Places In New Jersey
Click any column to sort. Search by city name.
| Rank | City | Households | LGBTQ Households | % Gay Households |
|---|---|---|---|---|
| 1 | Ocean Grove | 1,754 | 190 | 10.8% |
| 2 | West Belmar | 1,226 | 68 | 5.5% |
| 3 | Collingswood | 6,517 | 317 | 4.9% |
| 4 | Asbury Park | 7,499 | 320 | 4.3% |
| 5 | Sewaren | 1,291 | 54 | 4.2% |
| 6 | Watchung | 2,357 | 91 | 3.9% |
| 7 | Lambertville | 2,249 | 85 | 3.8% |
| 8 | Brookdale | 3,503 | 132 | 3.8% |
| 9 | Pine Hill | 4,488 | 169 | 3.8% |
| 10 | High Bridge | 1,415 | 53 | 3.7% |
| 11 | Silver Lake CDP (Essex County) | 1,529 | 55 | 3.6% |
| 12 | Mystic Island | 3,682 | 130 | 3.5% |
| 13 | Shark River Hills | 1,244 | 40 | 3.2% |
| 14 | White House Station | 1,873 | 53 | 2.8% |
| 15 | Avenel | 5,615 | 157 | 2.8% |
| 16 | Kenilworth | 2,842 | 78 | 2.7% |
| 17 | Fairview | 1,442 | 39 | 2.7% |
| 18 | Kendall Park | 3,483 | 94 | 2.7% |
| 19 | Guttenberg | 5,203 | 137 | 2.6% |
| 20 | Oaklyn | 1,723 | 43 | 2.5% |
| 21 | Westwood | 4,049 | 100 | 2.5% |
| 22 | Moonachie | 1,061 | 25 | 2.4% |
| 23 | Lindenwold | 9,317 | 216 | 2.3% |
| 24 | Palmyra | 3,287 | 75 | 2.3% |
| 25 | Ringwood | 4,186 | 94 | 2.2% |
| 26 | Twin Rivers | 3,106 | 68 | 2.2% |
| 27 | Bloomingdale | 2,898 | 63 | 2.2% |
| 28 | Audubon | 3,382 | 72 | 2.1% |
| 29 | Bernardsville | 2,689 | 57 | 2.1% |
| 30 | Panther Valley | 2,101 | 43 | 2.0% |
| 31 | Wildwood Crest | 1,923 | 38 | 2.0% |
| 32 | Glendora | 2,178 | 43 | 2.0% |
| 33 | Westfield | 10,900 | 213 | 2.0% |
| 34 | Rutherford | 6,875 | 133 | 1.9% |
| 35 | Plainsboro Center | 1,461 | 28 | 1.9% |
| 36 | Tinton Falls | 8,700 | 165 | 1.9% |
| 37 | Riverton | 1,031 | 19 | 1.8% |
| 38 | Union Beach | 2,203 | 40 | 1.8% |
| 39 | Norwood | 1,966 | 35 | 1.8% |
| 40 | Highland Lakes | 1,750 | 31 | 1.8% |
| 41 | Ventnor City | 4,846 | 84 | 1.7% |
| 42 | Jersey City | 125,223 | 2,072 | 1.7% |
| 43 | Chatham | 2,972 | 49 | 1.6% |
| 44 | Pitman | 3,621 | 59 | 1.6% |
| 45 | Barrington | 3,471 | 56 | 1.6% |
| 46 | Flemington | 2,119 | 34 | 1.6% |
| 47 | Alpha | 1,060 | 16 | 1.5% |
| 48 | Somers Point | 4,644 | 70 | 1.5% |
| 49 | East Orange | 28,328 | 424 | 1.5% |
| 50 | Port Reading | 1,107 | 16 | 1.4% |
| 51 | Englewood Cliffs | 2,010 | 29 | 1.4% |
| 52 | Port Monmouth | 1,317 | 19 | 1.4% |
| 53 | Union City | 25,725 | 369 | 1.4% |
| 54 | Rossmoor | 2,400 | 34 | 1.4% |
| 55 | Oceanport | 2,687 | 38 | 1.4% |
| 56 | Bordentown | 1,717 | 24 | 1.4% |
| 57 | Spring Lake Heights | 2,440 | 34 | 1.4% |
| 58 | Six Mile Run | 1,224 | 17 | 1.4% |
| 59 | Pennsville | 4,946 | 68 | 1.4% |
| 60 | Caldwell | 3,799 | 52 | 1.4% |
| 61 | Ellisburg | 1,905 | 26 | 1.4% |
| 62 | Mays Landing | 2,418 | 33 | 1.4% |
| 63 | Tenafly | 5,227 | 70 | 1.3% |
| 64 | Butler | 3,490 | 46 | 1.3% |
| 65 | Old Bridge | 10,368 | 136 | 1.3% |
| 66 | Upper Montclair | 4,061 | 53 | 1.3% |
| 67 | Franklin | 2,224 | 29 | 1.3% |
| 68 | New Providence | 5,351 | 69 | 1.3% |
| 69 | Rahway | 12,257 | 158 | 1.3% |
| 70 | National Park | 1,028 | 13 | 1.3% |
| 71 | Lake Mohawk | 3,839 | 48 | 1.3% |
| 72 | Glen Ridge | 2,490 | 31 | 1.2% |
| 73 | Plainfield | 15,907 | 198 | 1.2% |
| 74 | Tuckerton | 1,615 | 20 | 1.2% |
| 75 | Maywood | 3,889 | 48 | 1.2% |
| 76 | Lodi | 9,687 | 119 | 1.2% |
| 77 | Brownville | 1,064 | 13 | 1.2% |
| 78 | Carteret | 8,224 | 100 | 1.2% |
| 79 | Monmouth Junction | 3,478 | 42 | 1.2% |
| 80 | Palisades Park | 7,472 | 90 | 1.2% |
| 81 | Cherry Hill Mall | 5,397 | 65 | 1.2% |
| 82 | Runnemede | 3,330 | 40 | 1.2% |
| 83 | Leisure Village East | 2,865 | 34 | 1.2% |
| 84 | Dover | 6,661 | 79 | 1.2% |
| 85 | Roselle | 8,407 | 99 | 1.2% |
| 86 | Point Pleasant Beach | 1,961 | 23 | 1.2% |
| 87 | Northfield | 3,257 | 38 | 1.2% |
| 88 | Phillipsburg | 6,556 | 76 | 1.2% |
| 89 | Hoboken | 28,088 | 325 | 1.2% |
| 90 | Roseland | 2,513 | 29 | 1.2% |
| 91 | Beachwood | 4,003 | 46 | 1.1% |
| 92 | Rumson | 2,451 | 28 | 1.1% |
| 93 | Echelon | 6,219 | 71 | 1.1% |
| 94 | Salem | 2,386 | 27 | 1.1% |
| 95 | Bound Brook | 4,605 | 52 | 1.1% |
| 96 | Woodbury | 4,206 | 47 | 1.1% |
| 97 | Edgewater | 7,217 | 80 | 1.1% |
| 98 | Highland Park | 6,436 | 70 | 1.1% |
| 99 | Bradley Beach | 2,233 | 24 | 1.1% |
| 100 | Dover Beaches North | 1,128 | 12 | 1.1% |
Source: U.S. Census ACS 2020-2024. Places with over 1,000 households.
Summary
There You Have It – The Most LGBT Friendly Cities In New Jersey For 2026
If you’re looking at the number of gay households in New Jersey, this is an accurate list.
The gayest cities in New Jersey are Ocean Grove, West Belmar, Collingswood, Asbury Park, Sewaren, Watchung, Lambertville, Brookdale, Pine Hill, and High Bridge. Not sold on New Jersey? Take the two-minute Find Your Place quiz and see which state actually fits you.


