Union City SnackAbility
Overall SnackAbility
Crime in Union City summary. We use data from the FBI to determine the crime rates in Union City. Key points include:
There were 1,285 total crimes in Union City in the last reporting year.
The overall crime rate per 100,000 people in Union City is 1,999.8 / 100k people.
The violent crime rate per 100,000 people in Union City is 314.4 / 100k people.
The property crime rate per 100,000 people in Union City is 1,685.4 / 100k people.
Overall, crime in Union City is -5.64% below the national average.
Total Crimes
Below National Average
Crime In Union City Comparison Table
| Statistic | Count Raw |
Union City / 100k People |
New Jersey / 100k People |
National / 100k People |
|---|---|---|---|---|
| Total Crimes Per 100K | 1,285 | 1,999.8 | 1,645.1 | 2,119.2 |
| Violent Crime | 202 | 314.4 | 217.7 | 359.0 |
| Murder | 1 | 1.6 | 2.3 | 5.0 |
| Robbery | 38 | 59.1 | 49.3 | 61.0 |
| Aggravated Assault | 156 | 242.8 | 148.8 | 256.0 |
| Property Crime | 1,083 | 1,685.4 | 1,427.3 | 1,760.0 |
| Burglary | 67 | 104.3 | 145.3 | 229.0 |
| Larceny | 954 | 1,484.7 | 1,119.4 | 1,272.0 |
| Car Theft | 62 | 96.5 | 162.6 | 259.0 |
Source: FBI Uniform Crime Reporting (2024)
Cost of living in Union City summary. We use data on the cost of living to determine how expensive it is to live in Union City. Real estate prices drive most of the variance in cost of living around New Jersey. Key points include:
The cost of living in Union City is 131 with 100 being average.
The cost of living in Union City is 1.3x higher than the national average.
The median home value in Union City is $567,090.
The median income in Union City is $64,310.
Union City's Overall Cost Of Living
Higher Than The National Average
Cost Of Living In Union City Comparison Table
| Living Expense | Union City | New Jersey | National Average |
|---|---|---|---|
| Overall | 131 | 125 | 100 |
| Services | 107 | 107 | 100 |
| Groceries | 112 | 113 | 100 |
| Health | 179 | 155 | 100 |
| Housing | 119 | 116 | 100 |
| Transportation | 110 | 112 | 100 |
| Utilities | 113 | 113 | 100 |
Source: Cost of living index, normalized to US average = 100
Union City, NJ Weather
The average high in Union City is 62.3° and the average low is 47.2°.
There are 72.7 days of precipitation each year.
Expect an average of 47.9 inches of precipitation each year with 25.6 inches of snow.
| Stat | Union City |
|---|---|
| Average Annual High | 62.3 |
| Average Annual Low | 47.2 |
| Annual Precipitation Days | 72.7 |
| Average Annual Precipitation | 47.9 |
| Average Annual Snowfall | 25.6 |
Average High
Days of Rain
Source: NOAA climate normals (30-year)
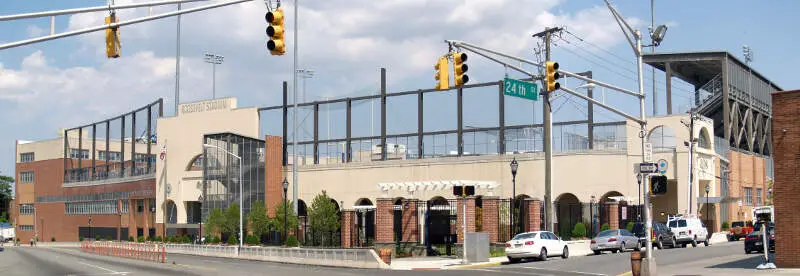
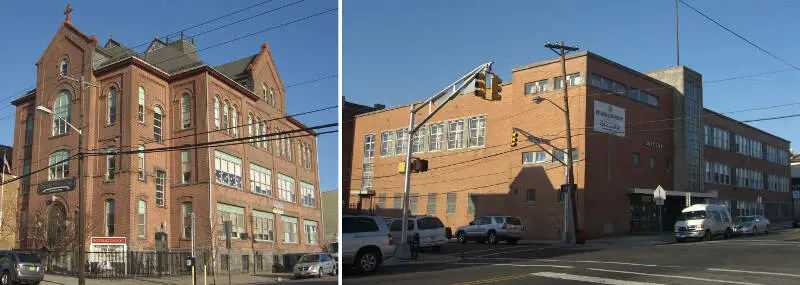
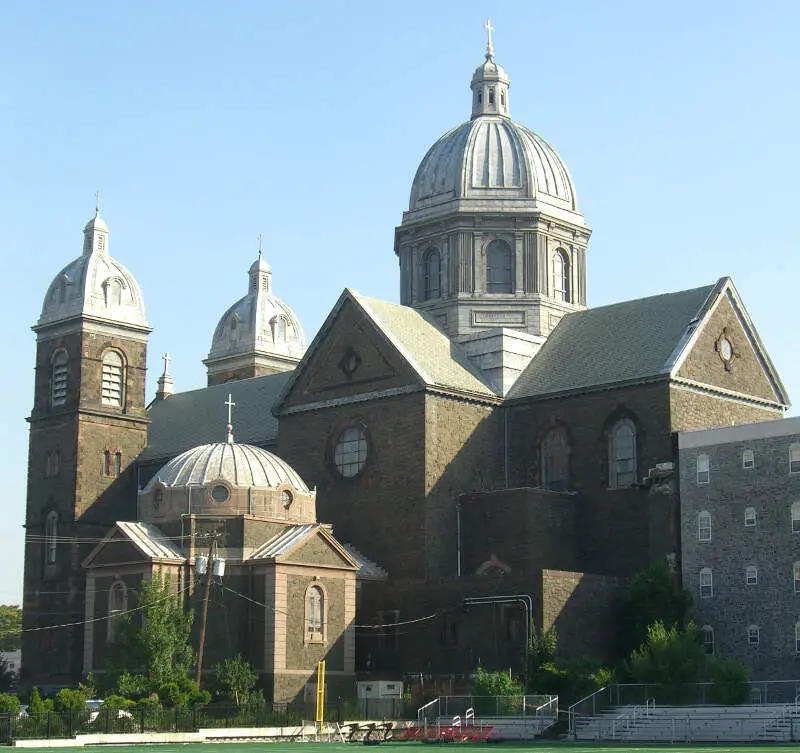
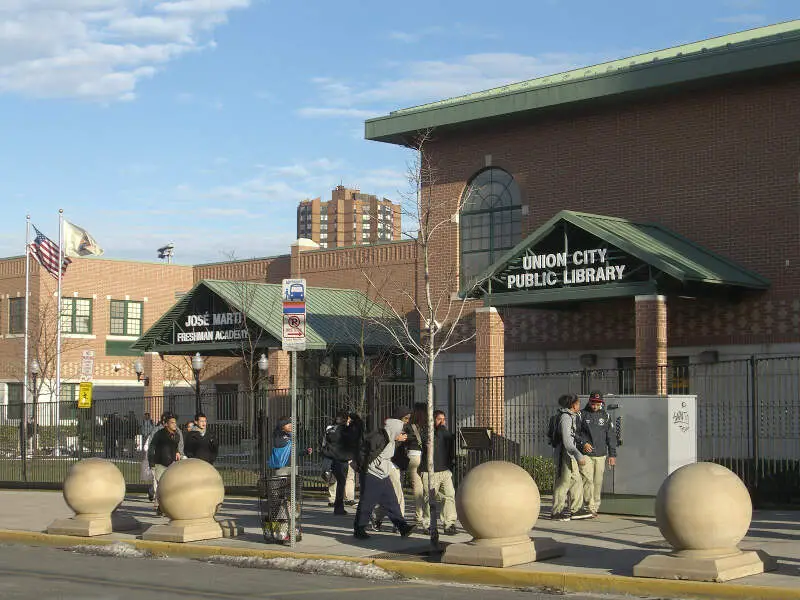
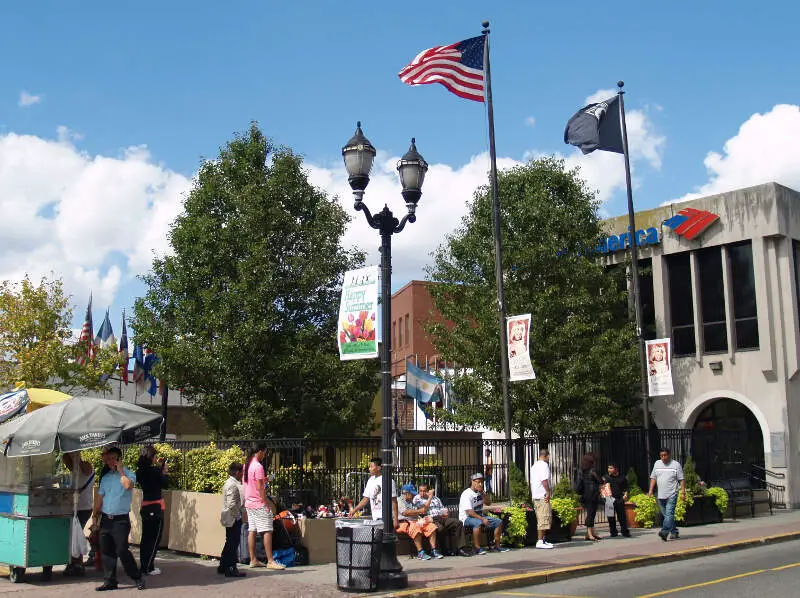
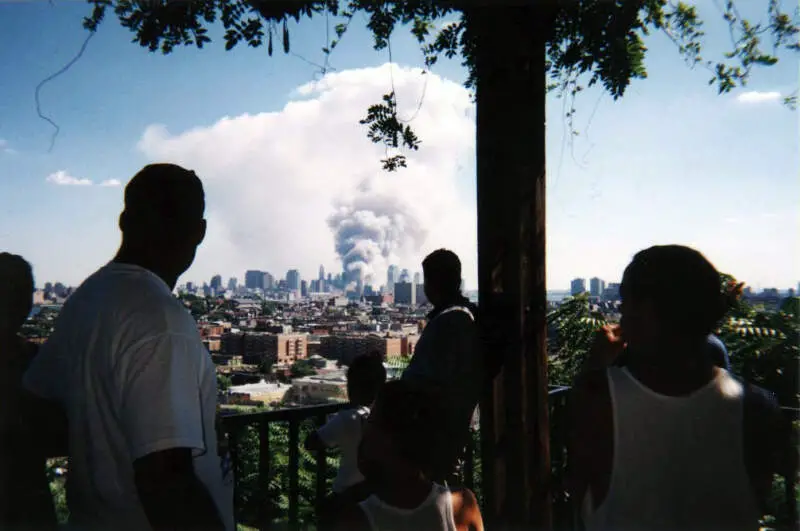
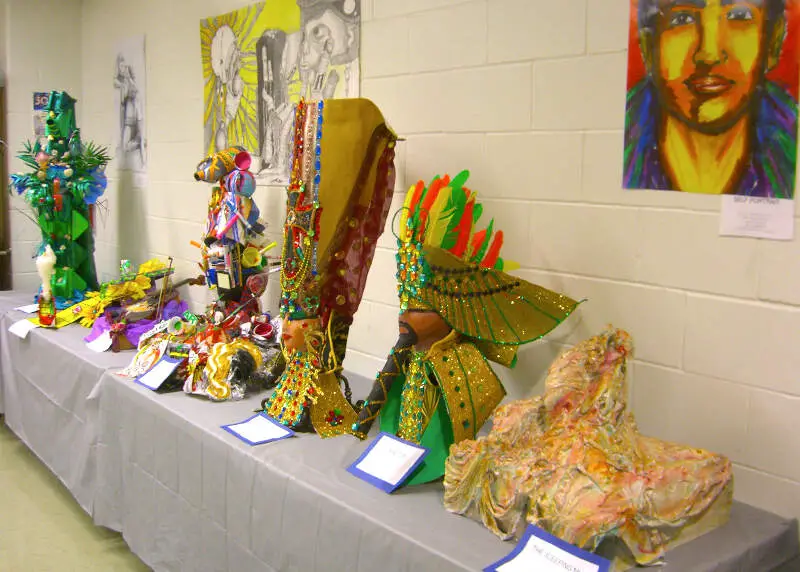
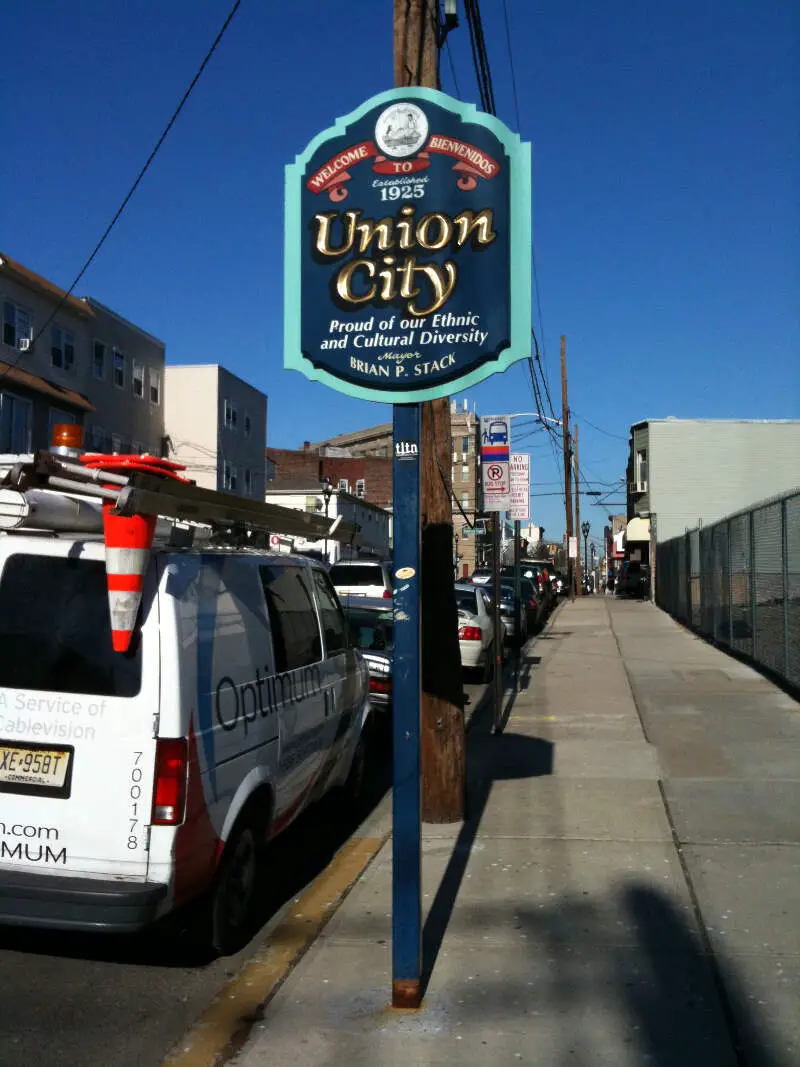
Union City, NJ Photos

6 Reviews & Comments About Union City

Let me tell u something you are completely wrong about union city...union city has alot of good schools n programs roads have been remade n there is alot of parks for children...crime is not high at all...every single city in this world has it's bad n it's good...only thing I can say is the pay rate should be better...have u ever really step foot in these cities...highly doubt it...i live in union city nj n guess wat...every single city has it's corruption it's drama crime n stuff...but at least union city has been making strides to look better...but wat union city needs to do is fire certain individuals like the director of the parks department Alicia...n I can care less if the f@*king B+ch sees this...
I Was born in union city it is one of Best places in nj when it hits night time
union city has one of the best public schools in New Jersey. but the overcrowding is true. I live in union city and it takes 2 hours to find parking
WOAH WOAH WOAH i live in union city it's not BAD I love living here the taxes are high but the city is nice
I live in Union City and its not a bad place
I've lived in Union City most of my life and yes, the area has deteriorated somewhat due to lower incomes and the economic downfall of NJ but I still love it here.
It has a low crime rate, NYC is around the corner, Hoboken is down the street, everything you need is close. The Meadowlands, theatres, malls and it's a hard working community for those who can find jobs. There are much, much worse cities you wouldn't set foot in not mentioned here.
Rankings & Articles For Union City


Locations Around Union City
Map Of Union City, NJ
Best Places Around Union City
Union City Demographics And Statistics
Population over time in Union City
The current population in Union City is 66,463. The population has increased 1.1% from 2010.
| Year | Population | % Change |
|---|---|---|
| 2024 | 66,463 | 0.1% |
| 2023 | 66,375 | -1.3% |
| 2022 | 67,258 | -0.9% |
| 2021 | 67,903 | -0.2% |
| 2020 | 68,073 | -0.2% |
| 2019 | 68,226 | -0.2% |
| 2018 | 68,362 | -2.1% |
| 2017 | 69,815 | 1.2% |
| 2016 | 68,965 | 0.5% |
| 2015 | 68,656 | 1.0% |
| 2014 | 68,001 | 1.1% |
| 2013 | 67,233 | 0.9% |
| 2012 | 66,646 | 0.8% |
| 2011 | 66,095 | 0.5% |
| 2010 | 65,766 | - |
Race / Ethnicity in Union City
See the full breakdown
Union City is:
9.5% White with 6,304 White residents.
3.3% African American with 2,221 African American residents.
0.0% American Indian with 14 American Indian residents.
3.3% Asian with 2,197 Asian residents.
0.1% Hawaiian with 42 Hawaiian residents.
0.5% Other with 358 Other residents.
1.4% Two Or More with 936 Two Or More residents.
81.8% Hispanic with 54,391 Hispanic residents.
| Race | Union City | NJ | USA |
|---|---|---|---|
| White | 9.5% | 50.9% | 57.4% |
| African American | 3.3% | 12.2% | 11.9% |
| American Indian | 0.0% | 0.1% | 0.5% |
| Asian | 3.3% | 10.0% | 5.9% |
| Hawaiian | 0.1% | 0.0% | 0.2% |
| Other | 0.5% | 0.8% | 0.6% |
| Two Or More | 1.4% | 3.5% | 4.3% |
| Hispanic | 81.8% | 22.5% | 19.3% |
Gender in Union City
See the full breakdown
Union City is 51.0% female with 33,873 female residents.
Union City is 49.0% male with 32,589 male residents.
| Gender | Union City | NJ | USA |
|---|---|---|---|
| Female | 51.0% | 50.8% | 50.5% |
| Male | 49.0% | 49.2% | 49.5% |
Highest level of educational attainment in Union City for adults over 25
See the full breakdown
13.0% of adults in Union City completed < 9th grade.
9.0% of adults in Union City completed 9-12th grade.
32.0% of adults in Union City completed high school / ged.
12.0% of adults in Union City completed some college.
5.0% of adults in Union City completed associate's degree.
20.0% of adults in Union City completed bachelor's degree.
7.0% of adults in Union City completed master's degree.
1.0% of adults in Union City completed professional degree.
1.0% of adults in Union City completed doctorate degree.
| Education | Union City | NJ | USA |
|---|---|---|---|
| < 9th Grade | 13.0% | 4.0% | 4.0% |
| 9-12th Grade | 9.0% | 5.0% | 6.0% |
| High School / GED | 32.0% | 25.0% | 26.0% |
| Some College | 12.0% | 15.0% | 19.0% |
| Associate's Degree | 5.0% | 7.0% | 9.0% |
| Bachelor's Degree | 20.0% | 26.0% | 22.0% |
| Master's Degree | 7.0% | 13.0% | 10.0% |
| Professional Degree | 1.0% | 3.0% | 2.0% |
| Doctorate Degree | 1.0% | 2.0% | 2.0% |
Household Income For Union City, New Jersey
See the full breakdown
7.4% of households in Union City earn Less than $10,000.
5.6% of households in Union City earn $10,000 to $14,999.
8.8% of households in Union City earn $15,000 to $24,999.
9.4% of households in Union City earn $25,000 to $34,999.
9.3% of households in Union City earn $35,000 to $49,999.
15.6% of households in Union City earn $50,000 to $74,999.
13.4% of households in Union City earn $75,000 to $99,999.
16.8% of households in Union City earn $100,000 to $149,999.
5.1% of households in Union City earn $150,000 to $199,999.
8.7% of households in Union City earn $200,000 or more.
| Income | Union City | NJ | USA |
|---|---|---|---|
| Less than $10,000 | 7.4% | 4.1% | 5.0% |
| $10,000 to $14,999 | 5.6% | 2.7% | 3.4% |
| $15,000 to $24,999 | 8.8% | 4.8% | 6.3% |
| $25,000 to $34,999 | 9.4% | 5.1% | 6.6% |
| $35,000 to $49,999 | 9.3% | 7.6% | 10.1% |
| $50,000 to $74,999 | 15.6% | 12.8% | 15.5% |
| $75,000 to $99,999 | 13.4% | 11.3% | 12.6% |
| $100,000 to $149,999 | 16.8% | 18.1% | 17.5% |
| $150,000 to $199,999 | 5.1% | 11.8% | 9.6% |
| $200,000 or more | 8.7% | 21.6% | 13.4% |
Source: U.S. Census ACS 5-year estimates (2024)


