Salem SnackAbility
Overall SnackAbility
Crime in Salem summary. We use data from the FBI to determine the crime rates in Salem. Key points include:
There were 251 total crimes in Salem in the last reporting year.
The overall crime rate per 100,000 people in Salem is 4,703.0 / 100k people.
The violent crime rate per 100,000 people in Salem is 2,098.6 / 100k people.
The property crime rate per 100,000 people in Salem is 2,604.5 / 100k people.
Overall, crime in Salem is 121.92% above the national average.
Total Crimes
Above National Average
Crime In Salem Comparison Table
| Statistic | Count Raw |
Salem / 100k People |
New Jersey / 100k People |
National / 100k People |
|---|---|---|---|---|
| Total Crimes Per 100K | 251 | 4,703.0 | 1,645.1 | 2,119.2 |
| Violent Crime | 112 | 2,098.6 | 217.7 | 359.0 |
| Murder | 1 | 18.7 | 2.3 | 5.0 |
| Robbery | 8 | 149.9 | 49.3 | 61.0 |
| Aggravated Assault | 92 | 1,723.8 | 148.8 | 256.0 |
| Property Crime | 139 | 2,604.5 | 1,427.3 | 1,760.0 |
| Burglary | 54 | 1,011.8 | 145.3 | 229.0 |
| Larceny | 67 | 1,255.4 | 1,119.4 | 1,272.0 |
| Car Theft | 18 | 337.3 | 162.6 | 259.0 |
Source: FBI Uniform Crime Reporting (2024)
Salem, NJ Weather
The average high in Salem is 65.0° and the average low is 46.1°.
There are 71.6 days of precipitation each year.
Expect an average of 42.9 inches of precipitation each year with 15.2 inches of snow.
| Stat | Salem |
|---|---|
| Average Annual High | 65.0 |
| Average Annual Low | 46.1 |
| Annual Precipitation Days | 71.6 |
| Average Annual Precipitation | 42.9 |
| Average Annual Snowfall | 15.2 |
Average High
Days of Rain
Source: NOAA climate normals (30-year)
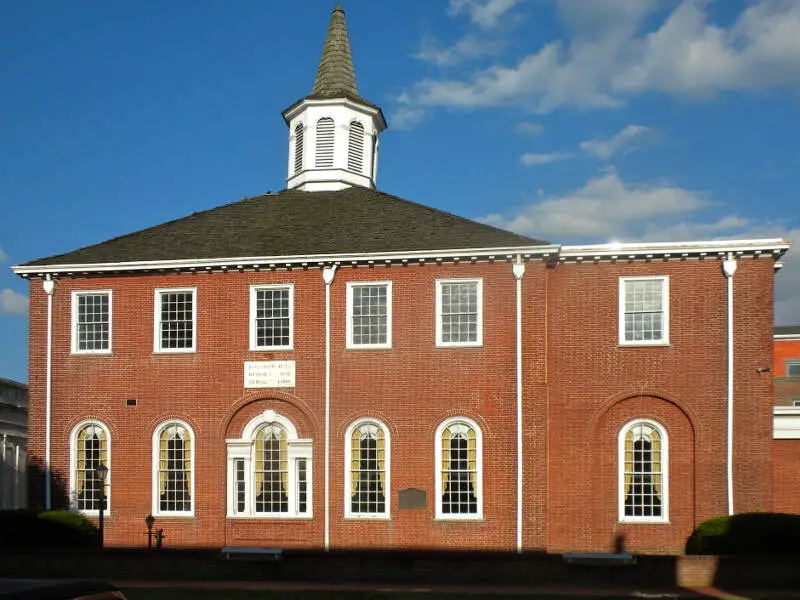
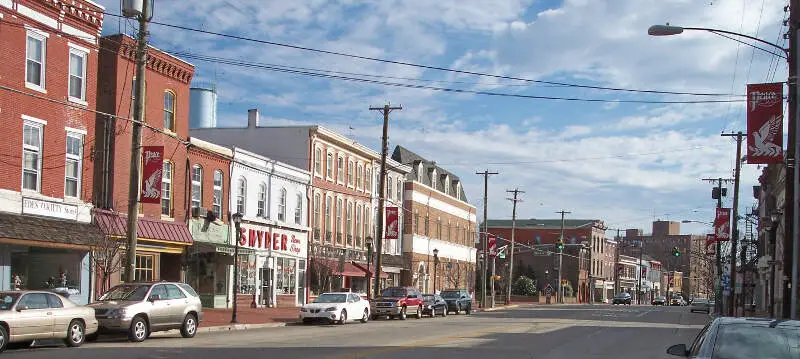
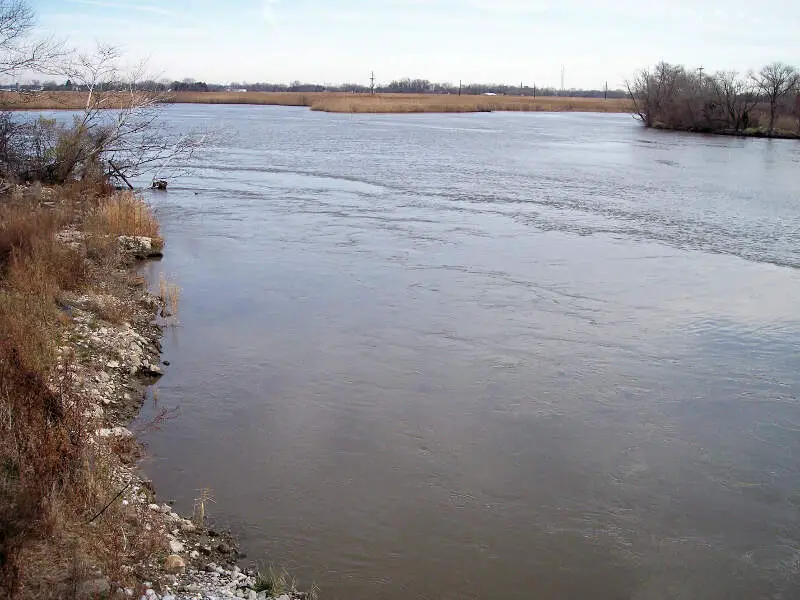
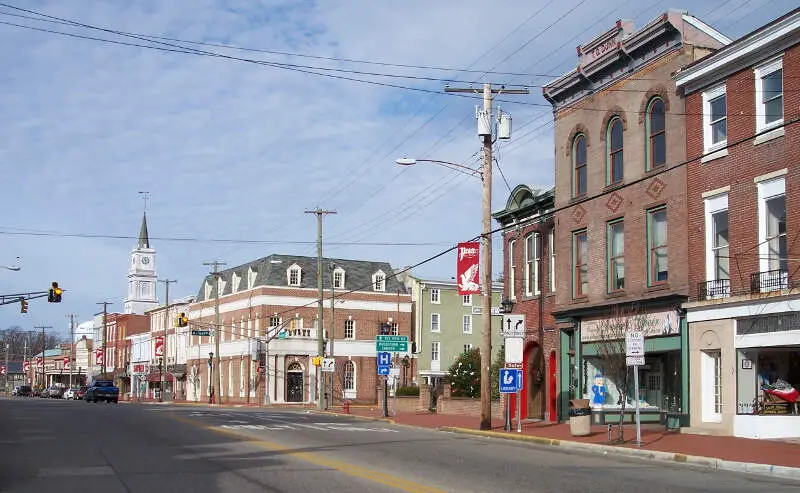
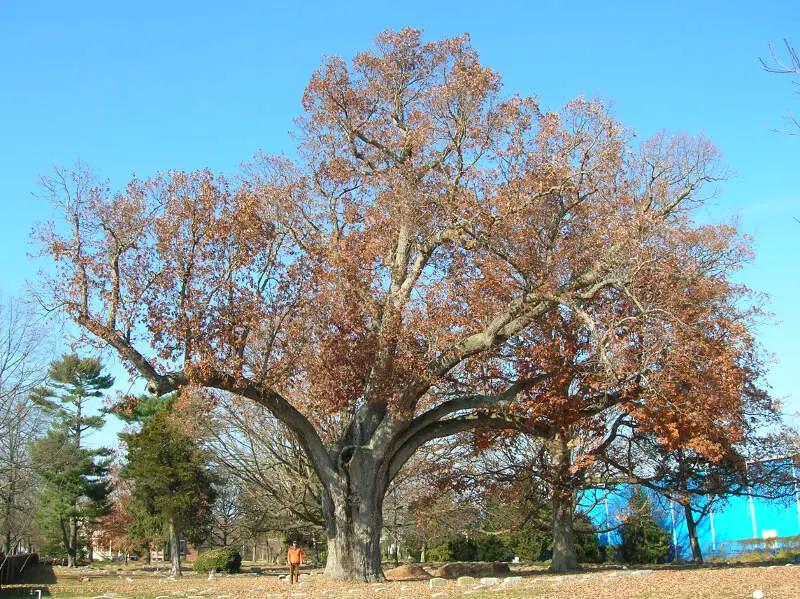
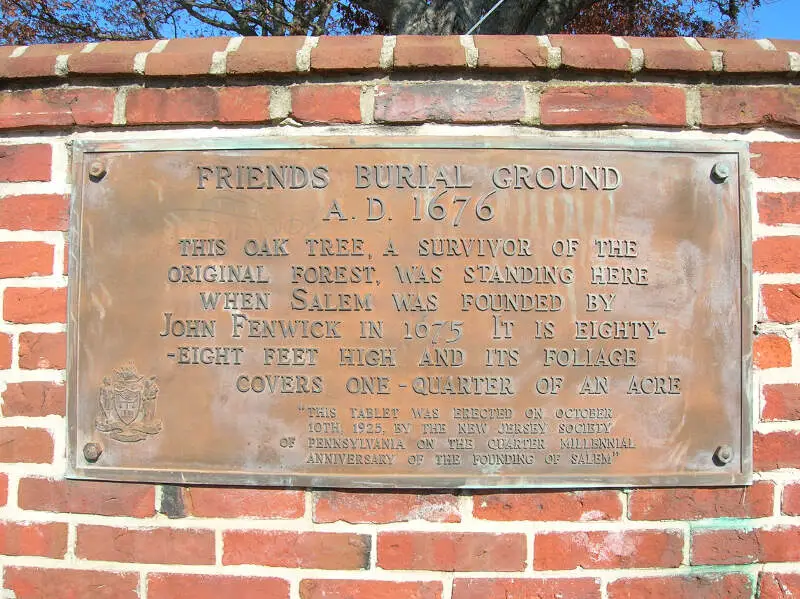
Salem, NJ Photos
Rankings & Articles For Salem


Locations Around Salem
Map Of Salem, NJ
Best Places Around Salem
Pennsville, NJ
Population 12,233
Carneys Point, NJ
Population 8,050
Pike Creek, DE
Population 7,129
Hockessin, DE
Population 13,439
North Star, DE
Population 7,834
Glasgow, DE
Population 15,546
Pike Creek Valley, DE
Population 12,431
Salem Demographics And Statistics
Population over time in Salem
The current population in Salem is 5,322. The population has increased 0.6% from 2010.
| Year | Population | % Change |
|---|---|---|
| 2024 | 5,322 | 0.1% |
| 2023 | 5,315 | 0.6% |
| 2022 | 5,285 | 0.9% |
| 2021 | 5,237 | 10.0% |
| 2020 | 4,761 | -0.4% |
| 2019 | 4,781 | -0.6% |
| 2018 | 4,811 | -1.4% |
| 2017 | 4,877 | -1.1% |
| 2016 | 4,931 | -1.3% |
| 2015 | 4,997 | -1.0% |
| 2014 | 5,045 | -1.3% |
| 2013 | 5,111 | -1.6% |
| 2012 | 5,195 | -0.8% |
| 2011 | 5,239 | -0.9% |
| 2010 | 5,289 | - |
Race / Ethnicity in Salem
See the full breakdown
Salem is:
29.1% White with 1,548 White residents.
57.1% African American with 3,041 African American residents.
0.0% American Indian with 0 American Indian residents.
0.9% Asian with 47 Asian residents.
0.0% Hawaiian with 0 Hawaiian residents.
0.2% Other with 10 Other residents.
4.0% Two Or More with 214 Two Or More residents.
8.7% Hispanic with 462 Hispanic residents.
| Race | Salem | NJ | USA |
|---|---|---|---|
| White | 29.1% | 50.9% | 57.4% |
| African American | 57.1% | 12.2% | 11.9% |
| American Indian | 0.0% | 0.1% | 0.5% |
| Asian | 0.9% | 10.0% | 5.9% |
| Hawaiian | 0.0% | 0.0% | 0.2% |
| Other | 0.2% | 0.8% | 0.6% |
| Two Or More | 4.0% | 3.5% | 4.3% |
| Hispanic | 8.7% | 22.5% | 19.3% |
Gender in Salem
See the full breakdown
Salem is 57.0% female with 3,036 female residents.
Salem is 43.0% male with 2,286 male residents.
| Gender | Salem | NJ | USA |
|---|---|---|---|
| Female | 57.0% | 50.8% | 50.5% |
| Male | 43.0% | 49.2% | 49.5% |
Highest level of educational attainment in Salem for adults over 25
See the full breakdown
6.0% of adults in Salem completed < 9th grade.
13.0% of adults in Salem completed 9-12th grade.
41.0% of adults in Salem completed high school / ged.
18.0% of adults in Salem completed some college.
7.0% of adults in Salem completed associate's degree.
11.0% of adults in Salem completed bachelor's degree.
3.0% of adults in Salem completed master's degree.
0.0% of adults in Salem completed professional degree.
1.0% of adults in Salem completed doctorate degree.
| Education | Salem | NJ | USA |
|---|---|---|---|
| < 9th Grade | 6.0% | 4.0% | 4.0% |
| 9-12th Grade | 13.0% | 5.0% | 6.0% |
| High School / GED | 41.0% | 25.0% | 26.0% |
| Some College | 18.0% | 15.0% | 19.0% |
| Associate's Degree | 7.0% | 7.0% | 9.0% |
| Bachelor's Degree | 11.0% | 26.0% | 22.0% |
| Master's Degree | 3.0% | 13.0% | 10.0% |
| Professional Degree | 0.0% | 3.0% | 2.0% |
| Doctorate Degree | 1.0% | 2.0% | 2.0% |
Household Income For Salem, New Jersey
See the full breakdown
4.6% of households in Salem earn Less than $10,000.
16.8% of households in Salem earn $10,000 to $14,999.
13.6% of households in Salem earn $15,000 to $24,999.
14.1% of households in Salem earn $25,000 to $34,999.
7.0% of households in Salem earn $35,000 to $49,999.
22.3% of households in Salem earn $50,000 to $74,999.
5.2% of households in Salem earn $75,000 to $99,999.
9.1% of households in Salem earn $100,000 to $149,999.
5.2% of households in Salem earn $150,000 to $199,999.
2.1% of households in Salem earn $200,000 or more.
| Income | Salem | NJ | USA |
|---|---|---|---|
| Less than $10,000 | 4.6% | 4.1% | 5.0% |
| $10,000 to $14,999 | 16.8% | 2.7% | 3.4% |
| $15,000 to $24,999 | 13.6% | 4.8% | 6.3% |
| $25,000 to $34,999 | 14.1% | 5.1% | 6.6% |
| $35,000 to $49,999 | 7.0% | 7.6% | 10.1% |
| $50,000 to $74,999 | 22.3% | 12.8% | 15.5% |
| $75,000 to $99,999 | 5.2% | 11.3% | 12.6% |
| $100,000 to $149,999 | 9.1% | 18.1% | 17.5% |
| $150,000 to $199,999 | 5.2% | 11.8% | 9.6% |
| $200,000 or more | 2.1% | 21.6% | 13.4% |
Source: U.S. Census ACS 5-year estimates (2024)


