Cedar Rapids SnackAbility
Overall SnackAbility
Crime in Cedar Rapids summary. We use data from the FBI to determine the crime rates in Cedar Rapids. Key points include:
There were 3,994 total crimes in Cedar Rapids in the last reporting year.
The overall crime rate per 100,000 people in Cedar Rapids is 2,950.6 / 100k people.
The violent crime rate per 100,000 people in Cedar Rapids is 261.5 / 100k people.
The property crime rate per 100,000 people in Cedar Rapids is 2,689.1 / 100k people.
Overall, crime in Cedar Rapids is 39.23% above the national average.
Total Crimes
Above National Average
Crime In Cedar Rapids Comparison Table
| Statistic | Count Raw |
Cedar Rapids / 100k People |
Iowa / 100k People |
National / 100k People |
|---|---|---|---|---|
| Total Crimes Per 100K | 3,994 | 2,950.6 | 1,540.0 | 2,119.2 |
| Violent Crime | 354 | 261.5 | 243.3 | 359.0 |
| Murder | 1 | 0.7 | 2.1 | 5.0 |
| Robbery | 41 | 30.3 | 18.7 | 61.0 |
| Aggravated Assault | 297 | 219.4 | 187.2 | 256.0 |
| Property Crime | 3,640 | 2,689.1 | 1,296.8 | 1,760.0 |
| Burglary | 371 | 274.1 | 199.1 | 229.0 |
| Larceny | 2,982 | 2,203.0 | 962.6 | 1,272.0 |
| Car Theft | 287 | 212.0 | 135.1 | 259.0 |
Source: FBI Uniform Crime Reporting (2024)
Cost of living in Cedar Rapids summary. We use data on the cost of living to determine how expensive it is to live in Cedar Rapids. Real estate prices drive most of the variance in cost of living around Iowa. Key points include:
The cost of living in Cedar Rapids is 92 with 100 being average.
The cost of living in Cedar Rapids is 0.9x lower than the national average.
The median home value in Cedar Rapids is $204,111.
The median income in Cedar Rapids is $70,424.
Cedar Rapids's Overall Cost Of Living
Lower Than The National Average
Cost Of Living In Cedar Rapids Comparison Table
| Living Expense | Cedar Rapids | Iowa | National Average |
|---|---|---|---|
| Overall | 92 | 90 | 100 |
| Services | 98 | 99 | 100 |
| Groceries | 94 | 95 | 100 |
| Health | 80 | 75 | 100 |
| Housing | 99 | 97 | 100 |
| Transportation | 97 | 93 | 100 |
| Utilities | 97 | 94 | 100 |
Source: Cost of living index, normalized to US average = 100
Cedar Rapids, IA Weather
The average high in Cedar Rapids is 58.9° and the average low is 38.7°.
There are 67.7 days of precipitation each year.
Expect an average of 37.6 inches of precipitation each year with 28.6 inches of snow.
| Stat | Cedar Rapids |
|---|---|
| Average Annual High | 58.9 |
| Average Annual Low | 38.7 |
| Annual Precipitation Days | 67.7 |
| Average Annual Precipitation | 37.6 |
| Average Annual Snowfall | 28.6 |
Average High
Days of Rain
Source: NOAA climate normals (30-year)
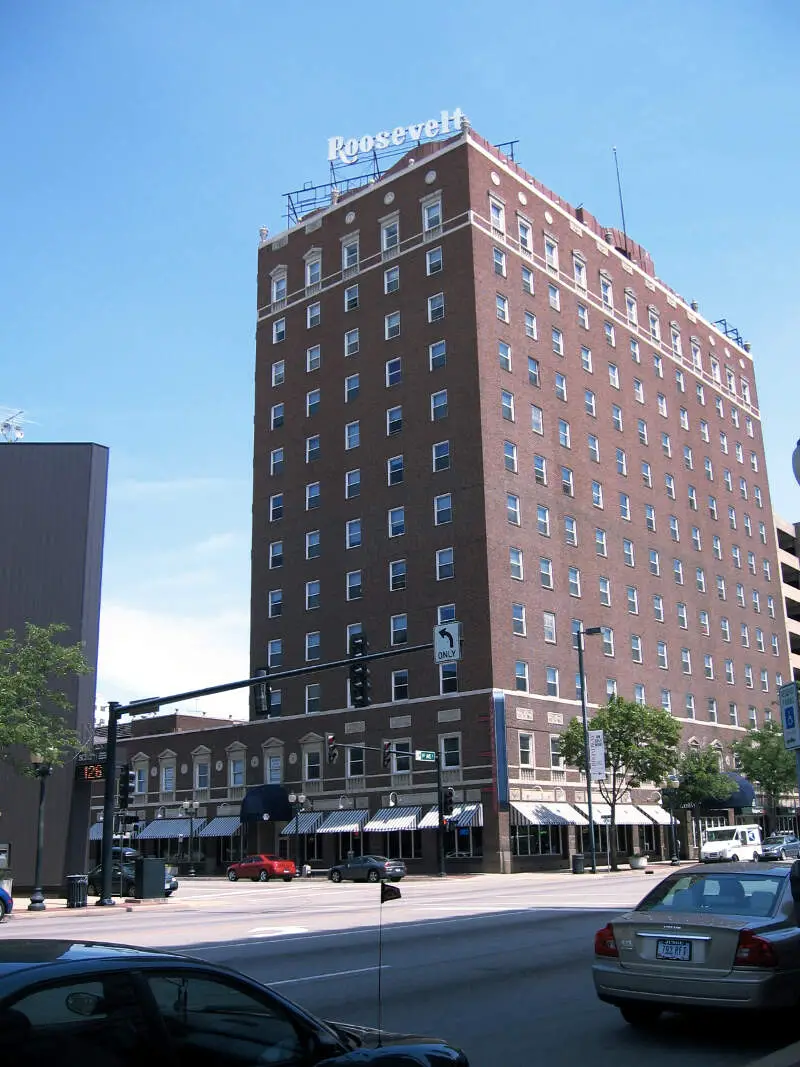
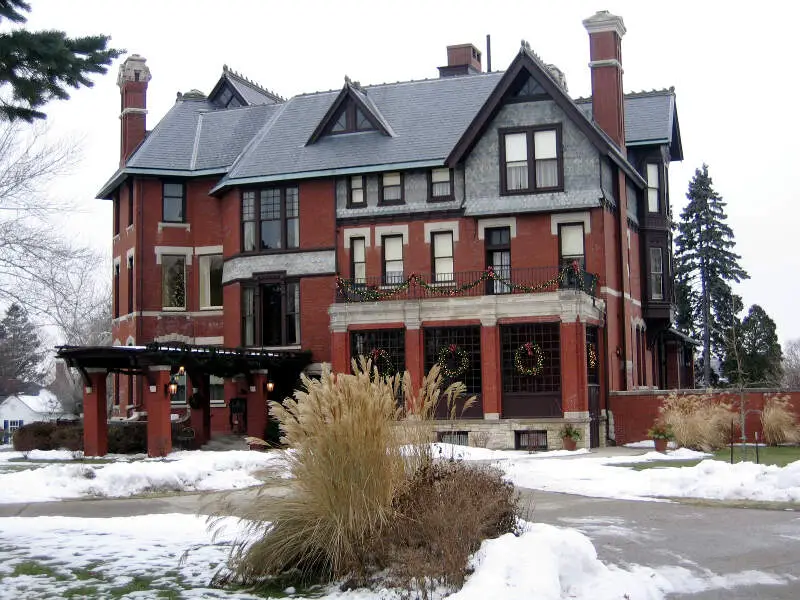
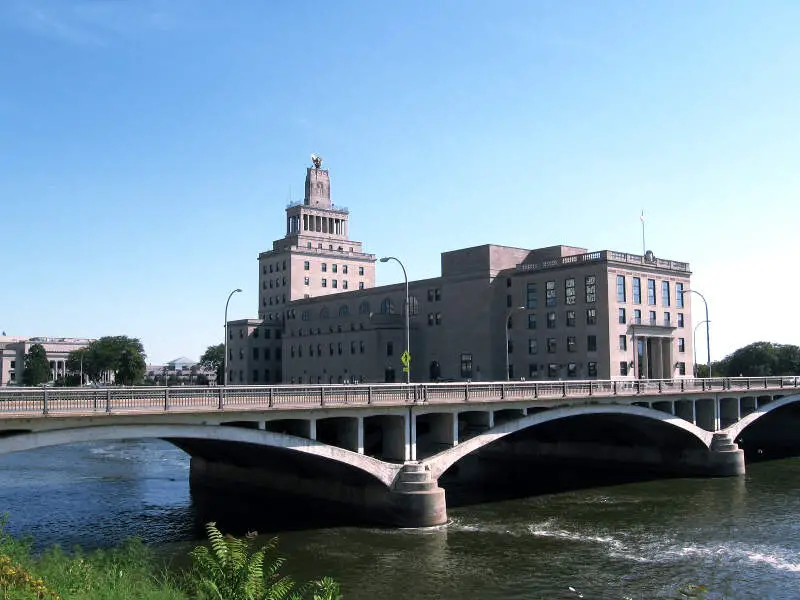
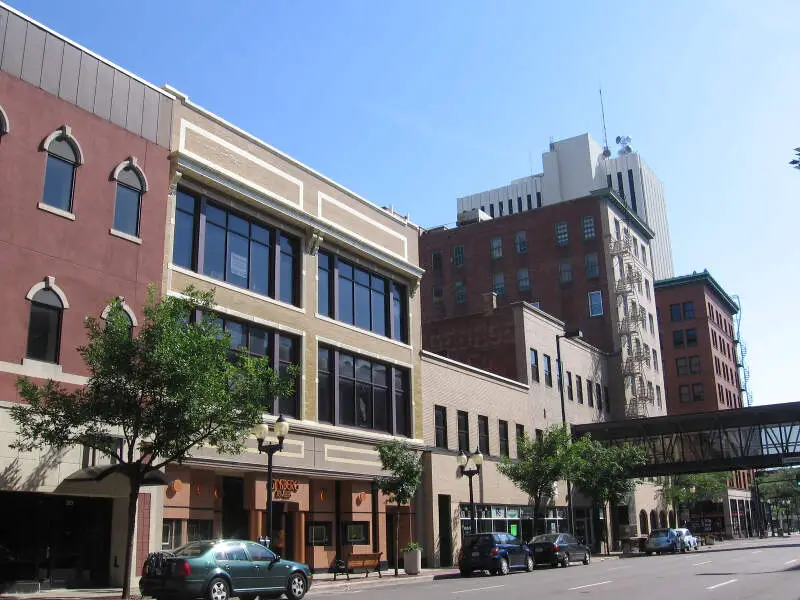
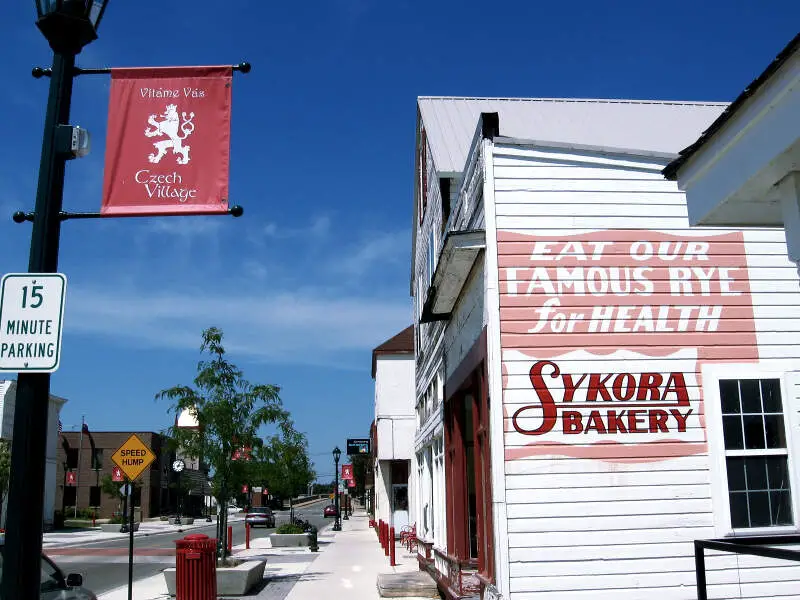
Cedar Rapids, IA Photos


Rankings & Articles For Cedar Rapids


Locations Around Cedar Rapids
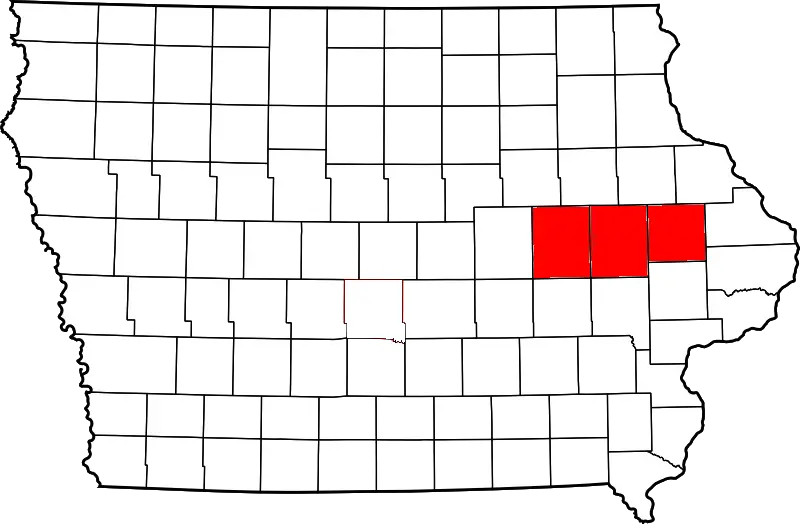
Map Of Cedar Rapids, IA
Best Places Around Cedar Rapids
North Liberty, IA
Population 21,125
Marion, IA
Population 41,896
Coralville, IA
Population 23,234
Hiawatha, IA
Population 7,206
Central, LA
Population 29,783
Cedar Rapids Demographics And Statistics
Population over time in Cedar Rapids
The current population in Cedar Rapids is 137,264. The population has increased 9.4% from 2010.
| Year | Population | % Change |
|---|---|---|
| 2024 | 137,264 | 0.3% |
| 2023 | 136,859 | -0.1% |
| 2022 | 136,929 | 0.3% |
| 2021 | 136,512 | 2.5% |
| 2020 | 133,125 | 0.6% |
| 2019 | 132,301 | 0.7% |
| 2018 | 131,360 | 0.8% |
| 2017 | 130,330 | 0.6% |
| 2016 | 129,537 | 0.5% |
| 2015 | 128,829 | 0.6% |
| 2014 | 128,009 | 0.5% |
| 2013 | 127,420 | 0.4% |
| 2012 | 126,921 | 0.5% |
| 2011 | 126,306 | 0.7% |
| 2010 | 125,450 | - |
Race / Ethnicity in Cedar Rapids
See the full breakdown
Cedar Rapids is:
77.5% White with 106,383 White residents.
8.5% African American with 11,682 African American residents.
0.1% American Indian with 109 American Indian residents.
2.6% Asian with 3,581 Asian residents.
0.0% Hawaiian with 13 Hawaiian residents.
0.6% Other with 763 Other residents.
5.6% Two Or More with 7,621 Two Or More residents.
5.2% Hispanic with 7,112 Hispanic residents.
| Race | Cedar Rapids | IA | USA |
|---|---|---|---|
| White | 77.5% | 82.3% | 57.4% |
| African American | 8.5% | 3.8% | 11.9% |
| American Indian | 0.1% | 0.2% | 0.5% |
| Asian | 2.6% | 2.5% | 5.9% |
| Hawaiian | 0.0% | 0.2% | 0.2% |
| Other | 0.6% | 0.3% | 0.6% |
| Two Or More | 5.6% | 3.5% | 4.3% |
| Hispanic | 5.2% | 7.3% | 19.3% |
Gender in Cedar Rapids
See the full breakdown
Cedar Rapids is 50.4% female with 69,219 female residents.
Cedar Rapids is 49.6% male with 68,045 male residents.
| Gender | Cedar Rapids | IA | USA |
|---|---|---|---|
| Female | 50.4% | 49.8% | 50.5% |
| Male | 49.6% | 50.2% | 49.5% |
Highest level of educational attainment in Cedar Rapids for adults over 25
See the full breakdown
2.0% of adults in Cedar Rapids completed < 9th grade.
4.0% of adults in Cedar Rapids completed 9-12th grade.
27.0% of adults in Cedar Rapids completed high school / ged.
22.0% of adults in Cedar Rapids completed some college.
12.0% of adults in Cedar Rapids completed associate's degree.
22.0% of adults in Cedar Rapids completed bachelor's degree.
8.0% of adults in Cedar Rapids completed master's degree.
2.0% of adults in Cedar Rapids completed professional degree.
1.0% of adults in Cedar Rapids completed doctorate degree.
| Education | Cedar Rapids | IA | USA |
|---|---|---|---|
| < 9th Grade | 2.0% | 3.0% | 4.0% |
| 9-12th Grade | 4.0% | 4.0% | 6.0% |
| High School / GED | 27.0% | 30.0% | 26.0% |
| Some College | 22.0% | 20.0% | 19.0% |
| Associate's Degree | 12.0% | 12.0% | 9.0% |
| Bachelor's Degree | 22.0% | 21.0% | 22.0% |
| Master's Degree | 8.0% | 7.0% | 10.0% |
| Professional Degree | 2.0% | 2.0% | 2.0% |
| Doctorate Degree | 1.0% | 1.0% | 2.0% |
Household Income For Cedar Rapids, Iowa
See the full breakdown
4.2% of households in Cedar Rapids earn Less than $10,000.
2.8% of households in Cedar Rapids earn $10,000 to $14,999.
6.6% of households in Cedar Rapids earn $15,000 to $24,999.
8.0% of households in Cedar Rapids earn $25,000 to $34,999.
13.4% of households in Cedar Rapids earn $35,000 to $49,999.
18.7% of households in Cedar Rapids earn $50,000 to $74,999.
14.7% of households in Cedar Rapids earn $75,000 to $99,999.
16.3% of households in Cedar Rapids earn $100,000 to $149,999.
7.8% of households in Cedar Rapids earn $150,000 to $199,999.
7.6% of households in Cedar Rapids earn $200,000 or more.
| Income | Cedar Rapids | IA | USA |
|---|---|---|---|
| Less than $10,000 | 4.2% | 4.0% | 5.0% |
| $10,000 to $14,999 | 2.8% | 3.2% | 3.4% |
| $15,000 to $24,999 | 6.6% | 6.7% | 6.3% |
| $25,000 to $34,999 | 8.0% | 7.2% | 6.6% |
| $35,000 to $49,999 | 13.4% | 11.3% | 10.1% |
| $50,000 to $74,999 | 18.7% | 17.5% | 15.5% |
| $75,000 to $99,999 | 14.7% | 14.0% | 12.6% |
| $100,000 to $149,999 | 16.3% | 18.7% | 17.5% |
| $150,000 to $199,999 | 7.8% | 8.8% | 9.6% |
| $200,000 or more | 7.6% | 8.6% | 13.4% |
Source: U.S. Census ACS 5-year estimates (2024)


