North Liberty SnackAbility
Overall SnackAbility
Crime in North Liberty summary. We use data from the FBI to determine the crime rates in North Liberty. Key points include:
There were 101 total crimes in North Liberty in the last reporting year.
The overall crime rate per 100,000 people in North Liberty is 466.8 / 100k people.
The violent crime rate per 100,000 people in North Liberty is 69.3 / 100k people.
The property crime rate per 100,000 people in North Liberty is 397.5 / 100k people.
Overall, crime in North Liberty is -77.97% below the national average.
Total Crimes
Below National Average
Crime In North Liberty Comparison Table
| Statistic | Count Raw |
North Liberty / 100k People |
Iowa / 100k People |
National / 100k People |
|---|---|---|---|---|
| Total Crimes Per 100K | 101 | 466.8 | 1,540.0 | 2,119.2 |
| Violent Crime | 15 | 69.3 | 243.3 | 359.0 |
| Murder | 0 | 0.0 | 2.1 | 5.0 |
| Robbery | 0 | 0.0 | 18.7 | 61.0 |
| Aggravated Assault | 11 | 50.8 | 187.2 | 256.0 |
| Property Crime | 86 | 397.5 | 1,296.8 | 1,760.0 |
| Burglary | 20 | 92.4 | 199.1 | 229.0 |
| Larceny | 58 | 268.1 | 962.6 | 1,272.0 |
| Car Theft | 8 | 37.0 | 135.1 | 259.0 |
Source: FBI Uniform Crime Reporting (2024)
Cost of living in North Liberty summary. We use data on the cost of living to determine how expensive it is to live in North Liberty. Real estate prices drive most of the variance in cost of living around Iowa. Key points include:
The cost of living in North Liberty is 105 with 100 being average.
The cost of living in North Liberty is 1.1x higher than the national average.
The median home value in North Liberty is $307,635.
The median income in North Liberty is $102,102.
North Liberty's Overall Cost Of Living
Higher Than The National Average
Cost Of Living In North Liberty Comparison Table
| Living Expense | North Liberty | Iowa | National Average |
|---|---|---|---|
| Overall | 105 | 90 | 100 |
| Services | 96 | 99 | 100 |
| Groceries | 100 | 95 | 100 |
| Health | 123 | 75 | 100 |
| Housing | 96 | 97 | 100 |
| Transportation | 95 | 93 | 100 |
| Utilities | 96 | 94 | 100 |
Source: Cost of living index, normalized to US average = 100
North Liberty, IA Weather
The average high in North Liberty is 59.5° and the average low is 39.4°.
There are 64.8 days of precipitation each year.
Expect an average of 36.4 inches of precipitation each year with 26.8 inches of snow.
| Stat | North Liberty |
|---|---|
| Average Annual High | 59.5 |
| Average Annual Low | 39.4 |
| Annual Precipitation Days | 64.8 |
| Average Annual Precipitation | 36.4 |
| Average Annual Snowfall | 26.8 |
Average High
Days of Rain
Source: NOAA climate normals (30-year)
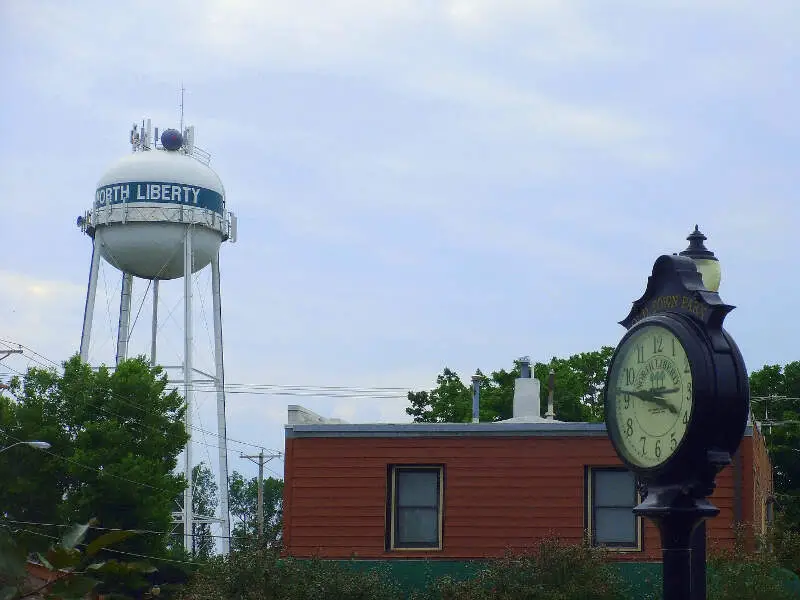
North Liberty, IA Photos

1 Reviews & Comments About North Liberty

This city is a part of the Iowa City community. It has a wide spectrum of economics, which makes it a great place to learn about people, and gives plenty of opportunity to help others or be helped. It is a "bedroom" community with a rapidly growing population. The schools are bursting and a new elementary school is being built. A high school was just opened in 2017.
North Liberty is convenient. Biking is an option because of a great trail, and also because two grocery stores, banks, rec center, gym, post office, car repair.... are in such close proximity to much of the city.
Rankings & Articles For North Liberty


Locations Around North Liberty
Map Of North Liberty, IA
Best Places Around North Liberty
Marion, IA
Population 41,896
Coralville, IA
Population 23,234
Hiawatha, IA
Population 7,206
Central, LA
Population 29,783
Washington, IA
Population 7,290
Anamosa, IA
Population 5,629
Cedar Rapids, IA
Population 137,264
Vinton, IA
Population 4,948
Muscatine, IA
Population 23,489
La Porte, IN
Population 22,449
North Liberty Demographics And Statistics
Population over time in North Liberty
The current population in North Liberty is 21,125. The population has increased 77.7% from 2010.
| Year | Population | % Change |
|---|---|---|
| 2024 | 21,125 | 1.7% |
| 2023 | 20,782 | 1.9% |
| 2022 | 20,393 | 2.1% |
| 2021 | 19,976 | 4.3% |
| 2020 | 19,159 | 1.8% |
| 2019 | 18,829 | 2.6% |
| 2018 | 18,357 | 3.6% |
| 2017 | 17,721 | 4.3% |
| 2016 | 16,984 | 13.4% |
| 2015 | 14,972 | 3.2% |
| 2014 | 14,503 | 4.0% |
| 2013 | 13,944 | 4.6% |
| 2012 | 13,330 | 6.1% |
| 2011 | 12,564 | 5.7% |
| 2010 | 11,889 | - |
Race / Ethnicity in North Liberty
See the full breakdown
North Liberty is:
79.2% White with 16,739 White residents.
4.0% African American with 852 African American residents.
0.0% American Indian with 6 American Indian residents.
4.2% Asian with 886 Asian residents.
0.1% Hawaiian with 12 Hawaiian residents.
0.1% Other with 12 Other residents.
5.9% Two Or More with 1,240 Two Or More residents.
6.5% Hispanic with 1,378 Hispanic residents.
| Race | North Liberty | IA | USA |
|---|---|---|---|
| White | 79.2% | 82.3% | 57.4% |
| African American | 4.0% | 3.8% | 11.9% |
| American Indian | 0.0% | 0.2% | 0.5% |
| Asian | 4.2% | 2.5% | 5.9% |
| Hawaiian | 0.1% | 0.2% | 0.2% |
| Other | 0.1% | 0.3% | 0.6% |
| Two Or More | 5.9% | 3.5% | 4.3% |
| Hispanic | 6.5% | 7.3% | 19.3% |
Gender in North Liberty
See the full breakdown
North Liberty is 48.9% female with 10,332 female residents.
North Liberty is 51.1% male with 10,793 male residents.
| Gender | North Liberty | IA | USA |
|---|---|---|---|
| Female | 48.9% | 49.8% | 50.5% |
| Male | 51.1% | 50.2% | 49.5% |
Highest level of educational attainment in North Liberty for adults over 25
See the full breakdown
1.0% of adults in North Liberty completed < 9th grade.
1.0% of adults in North Liberty completed 9-12th grade.
12.0% of adults in North Liberty completed high school / ged.
20.0% of adults in North Liberty completed some college.
12.0% of adults in North Liberty completed associate's degree.
36.0% of adults in North Liberty completed bachelor's degree.
13.0% of adults in North Liberty completed master's degree.
3.0% of adults in North Liberty completed professional degree.
2.0% of adults in North Liberty completed doctorate degree.
| Education | North Liberty | IA | USA |
|---|---|---|---|
| < 9th Grade | 1.0% | 3.0% | 4.0% |
| 9-12th Grade | 1.0% | 4.0% | 6.0% |
| High School / GED | 12.0% | 30.0% | 26.0% |
| Some College | 20.0% | 20.0% | 19.0% |
| Associate's Degree | 12.0% | 12.0% | 9.0% |
| Bachelor's Degree | 36.0% | 21.0% | 22.0% |
| Master's Degree | 13.0% | 7.0% | 10.0% |
| Professional Degree | 3.0% | 2.0% | 2.0% |
| Doctorate Degree | 2.0% | 1.0% | 2.0% |
Household Income For North Liberty, Iowa
See the full breakdown
2.4% of households in North Liberty earn Less than $10,000.
0.8% of households in North Liberty earn $10,000 to $14,999.
3.0% of households in North Liberty earn $15,000 to $24,999.
4.0% of households in North Liberty earn $25,000 to $34,999.
7.0% of households in North Liberty earn $35,000 to $49,999.
14.8% of households in North Liberty earn $50,000 to $74,999.
13.2% of households in North Liberty earn $75,000 to $99,999.
27.1% of households in North Liberty earn $100,000 to $149,999.
13.6% of households in North Liberty earn $150,000 to $199,999.
14.1% of households in North Liberty earn $200,000 or more.
| Income | North Liberty | IA | USA |
|---|---|---|---|
| Less than $10,000 | 2.4% | 4.0% | 5.0% |
| $10,000 to $14,999 | 0.8% | 3.2% | 3.4% |
| $15,000 to $24,999 | 3.0% | 6.7% | 6.3% |
| $25,000 to $34,999 | 4.0% | 7.2% | 6.6% |
| $35,000 to $49,999 | 7.0% | 11.3% | 10.1% |
| $50,000 to $74,999 | 14.8% | 17.5% | 15.5% |
| $75,000 to $99,999 | 13.2% | 14.0% | 12.6% |
| $100,000 to $149,999 | 27.1% | 18.7% | 17.5% |
| $150,000 to $199,999 | 13.6% | 8.8% | 9.6% |
| $200,000 or more | 14.1% | 8.6% | 13.4% |
Source: U.S. Census ACS 5-year estimates (2024)


