Centerville SnackAbility
Overall SnackAbility
Crime in Centerville summary. We use data from the FBI to determine the crime rates in Centerville. Key points include:
There were 70 total crimes in Centerville in the last reporting year.
The overall crime rate per 100,000 people in Centerville is 1,315.0 / 100k people.
The violent crime rate per 100,000 people in Centerville is 263.0 / 100k people.
The property crime rate per 100,000 people in Centerville is 1,052.0 / 100k people.
Overall, crime in Centerville is -37.95% below the national average.
Total Crimes
Below National Average
Crime In Centerville Comparison Table
| Statistic | Count Raw |
Centerville / 100k People |
Iowa / 100k People |
National / 100k People |
|---|---|---|---|---|
| Total Crimes Per 100K | 70 | 1,315.0 | 1,540.0 | 2,119.2 |
| Violent Crime | 14 | 263.0 | 243.3 | 359.0 |
| Murder | 0 | 0.0 | 2.1 | 5.0 |
| Robbery | 1 | 18.8 | 18.7 | 61.0 |
| Aggravated Assault | 10 | 187.9 | 187.2 | 256.0 |
| Property Crime | 56 | 1,052.0 | 1,296.8 | 1,760.0 |
| Burglary | 10 | 187.9 | 199.1 | 229.0 |
| Larceny | 43 | 807.8 | 962.6 | 1,272.0 |
| Car Theft | 3 | 56.4 | 135.1 | 259.0 |
Source: FBI Uniform Crime Reporting (2024)
Cost of living in Centerville summary. We use data on the cost of living to determine how expensive it is to live in Centerville. Real estate prices drive most of the variance in cost of living around Iowa. Key points include:
The cost of living in Centerville is 82 with 100 being average.
The cost of living in Centerville is 0.8x lower than the national average.
The median home value in Centerville is $80,251.
The median income in Centerville is $46,563.
Centerville's Overall Cost Of Living
Lower Than The National Average
Cost Of Living In Centerville Comparison Table
| Living Expense | Centerville | Iowa | National Average |
|---|---|---|---|
| Overall | 82 | 90 | 100 |
| Services | 94 | 99 | 100 |
| Groceries | 95 | 95 | 100 |
| Health | 49 | 75 | 100 |
| Housing | 97 | 97 | 100 |
| Transportation | 90 | 93 | 100 |
| Utilities | 99 | 94 | 100 |
Source: Cost of living index, normalized to US average = 100
Centerville, IA Weather
The average high in Centerville is 60.9° and the average low is 40.6°.
There are 62.5 days of precipitation each year.
Expect an average of 37.9 inches of precipitation each year with 22.0 inches of snow.
| Stat | Centerville |
|---|---|
| Average Annual High | 60.9 |
| Average Annual Low | 40.6 |
| Annual Precipitation Days | 62.5 |
| Average Annual Precipitation | 37.9 |
| Average Annual Snowfall | 22.0 |
Average High
Days of Rain
Source: NOAA climate normals (30-year)
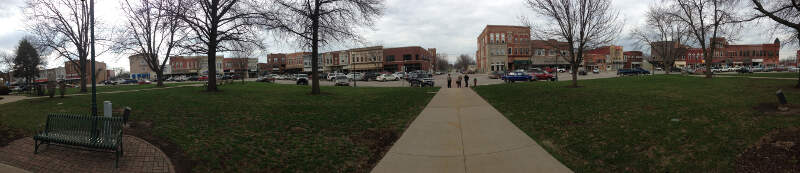
Centerville, IA Photos
1 Reviews & Comments About Centerville

Omg he's so right I live in centerville!,!,!,I f*****g hate it here!
Rankings & Articles For Centerville


Locations Around Centerville
Map Of Centerville, IA
Best Places Around Centerville
Green, OH
Population 27,393
Kirksville, MO
Population 17,563
Pella, IA
Population 10,720
Knoxville, IA
Population 7,473
Oskaloosa, IA
Population 11,504
Ottumwa, IA
Population 25,430
Centerville Demographics And Statistics
Population over time in Centerville
The current population in Centerville is 5,372. The population has decreased 4.0% from 2010.
| Year | Population | % Change |
|---|---|---|
| 2024 | 5,372 | -0.1% |
| 2023 | 5,377 | -0.3% |
| 2022 | 5,393 | 0.7% |
| 2021 | 5,353 | -1.5% |
| 2020 | 5,433 | -0.5% |
| 2019 | 5,458 | -0.5% |
| 2018 | 5,487 | -0.3% |
| 2017 | 5,503 | 1.8% |
| 2016 | 5,404 | -0.5% |
| 2015 | 5,431 | -0.9% |
| 2014 | 5,480 | -0.6% |
| 2013 | 5,512 | -0.1% |
| 2012 | 5,519 | -0.6% |
| 2011 | 5,552 | -0.7% |
| 2010 | 5,593 | - |
Race / Ethnicity in Centerville
See the full breakdown
Centerville is:
89.5% White with 4,809 White residents.
1.0% African American with 54 African American residents.
0.1% American Indian with 3 American Indian residents.
1.5% Asian with 82 Asian residents.
0.0% Hawaiian with 0 Hawaiian residents.
0.0% Other with 0 Other residents.
3.4% Two Or More with 185 Two Or More residents.
4.4% Hispanic with 239 Hispanic residents.
| Race | Centerville | IA | USA |
|---|---|---|---|
| White | 89.5% | 82.3% | 57.4% |
| African American | 1.0% | 3.8% | 11.9% |
| American Indian | 0.1% | 0.2% | 0.5% |
| Asian | 1.5% | 2.5% | 5.9% |
| Hawaiian | 0.0% | 0.2% | 0.2% |
| Other | 0.0% | 0.3% | 0.6% |
| Two Or More | 3.4% | 3.5% | 4.3% |
| Hispanic | 4.4% | 7.3% | 19.3% |
Gender in Centerville
See the full breakdown
Centerville is 50.4% female with 2,705 female residents.
Centerville is 49.6% male with 2,667 male residents.
| Gender | Centerville | IA | USA |
|---|---|---|---|
| Female | 50.4% | 49.8% | 50.5% |
| Male | 49.6% | 50.2% | 49.5% |
Highest level of educational attainment in Centerville for adults over 25
See the full breakdown
7.0% of adults in Centerville completed < 9th grade.
3.0% of adults in Centerville completed 9-12th grade.
40.0% of adults in Centerville completed high school / ged.
22.0% of adults in Centerville completed some college.
12.0% of adults in Centerville completed associate's degree.
13.0% of adults in Centerville completed bachelor's degree.
3.0% of adults in Centerville completed master's degree.
0.0% of adults in Centerville completed professional degree.
0.0% of adults in Centerville completed doctorate degree.
| Education | Centerville | IA | USA |
|---|---|---|---|
| < 9th Grade | 7.0% | 3.0% | 4.0% |
| 9-12th Grade | 3.0% | 4.0% | 6.0% |
| High School / GED | 40.0% | 30.0% | 26.0% |
| Some College | 22.0% | 20.0% | 19.0% |
| Associate's Degree | 12.0% | 12.0% | 9.0% |
| Bachelor's Degree | 13.0% | 21.0% | 22.0% |
| Master's Degree | 3.0% | 7.0% | 10.0% |
| Professional Degree | 0.0% | 2.0% | 2.0% |
| Doctorate Degree | 0.0% | 1.0% | 2.0% |
Household Income For Centerville, Iowa
See the full breakdown
4.9% of households in Centerville earn Less than $10,000.
7.8% of households in Centerville earn $10,000 to $14,999.
14.4% of households in Centerville earn $15,000 to $24,999.
15.0% of households in Centerville earn $25,000 to $34,999.
9.7% of households in Centerville earn $35,000 to $49,999.
21.1% of households in Centerville earn $50,000 to $74,999.
12.1% of households in Centerville earn $75,000 to $99,999.
8.2% of households in Centerville earn $100,000 to $149,999.
5.7% of households in Centerville earn $150,000 to $199,999.
1.2% of households in Centerville earn $200,000 or more.
| Income | Centerville | IA | USA |
|---|---|---|---|
| Less than $10,000 | 4.9% | 4.0% | 5.0% |
| $10,000 to $14,999 | 7.8% | 3.2% | 3.4% |
| $15,000 to $24,999 | 14.4% | 6.7% | 6.3% |
| $25,000 to $34,999 | 15.0% | 7.2% | 6.6% |
| $35,000 to $49,999 | 9.7% | 11.3% | 10.1% |
| $50,000 to $74,999 | 21.1% | 17.5% | 15.5% |
| $75,000 to $99,999 | 12.1% | 14.0% | 12.6% |
| $100,000 to $149,999 | 8.2% | 18.7% | 17.5% |
| $150,000 to $199,999 | 5.7% | 8.8% | 9.6% |
| $200,000 or more | 1.2% | 8.6% | 13.4% |
Source: U.S. Census ACS 5-year estimates (2024)


