Ottumwa SnackAbility
Overall SnackAbility
Crime in Ottumwa summary. We use data from the FBI to determine the crime rates in Ottumwa. Key points include:
There were 759 total crimes in Ottumwa in the last reporting year.
The overall crime rate per 100,000 people in Ottumwa is 3,013.7 / 100k people.
The violent crime rate per 100,000 people in Ottumwa is 397.1 / 100k people.
The property crime rate per 100,000 people in Ottumwa is 2,616.6 / 100k people.
Overall, crime in Ottumwa is 42.21% above the national average.
Total Crimes
Above National Average
Crime In Ottumwa Comparison Table
| Statistic | Count Raw |
Ottumwa / 100k People |
Iowa / 100k People |
National / 100k People |
|---|---|---|---|---|
| Total Crimes Per 100K | 759 | 3,013.7 | 1,540.0 | 2,119.2 |
| Violent Crime | 100 | 397.1 | 243.3 | 359.0 |
| Murder | 2 | 7.9 | 2.1 | 5.0 |
| Robbery | 7 | 27.8 | 18.7 | 61.0 |
| Aggravated Assault | 70 | 277.9 | 187.2 | 256.0 |
| Property Crime | 659 | 2,616.6 | 1,296.8 | 1,760.0 |
| Burglary | 108 | 428.8 | 199.1 | 229.0 |
| Larceny | 490 | 1,945.6 | 962.6 | 1,272.0 |
| Car Theft | 61 | 242.2 | 135.1 | 259.0 |
Source: FBI Uniform Crime Reporting (2024)
Cost of living in Ottumwa summary. We use data on the cost of living to determine how expensive it is to live in Ottumwa. Real estate prices drive most of the variance in cost of living around Iowa. Key points include:
The cost of living in Ottumwa is 84 with 100 being average.
The cost of living in Ottumwa is 0.8x lower than the national average.
The median home value in Ottumwa is $121,424.
The median income in Ottumwa is $61,103.
Ottumwa's Overall Cost Of Living
Lower Than The National Average
Cost Of Living In Ottumwa Comparison Table
| Living Expense | Ottumwa | Iowa | National Average |
|---|---|---|---|
| Overall | 84 | 90 | 100 |
| Services | 96 | 99 | 100 |
| Groceries | 100 | 95 | 100 |
| Health | 51 | 75 | 100 |
| Housing | 98 | 97 | 100 |
| Transportation | 95 | 93 | 100 |
| Utilities | 96 | 94 | 100 |
Source: Cost of living index, normalized to US average = 100
Ottumwa, IA Weather
The average high in Ottumwa is 61.7° and the average low is 41.2°.
There are 66.0 days of precipitation each year.
Expect an average of 38.4 inches of precipitation each year with 24.2 inches of snow.
| Stat | Ottumwa |
|---|---|
| Average Annual High | 61.7 |
| Average Annual Low | 41.2 |
| Annual Precipitation Days | 66.0 |
| Average Annual Precipitation | 38.4 |
| Average Annual Snowfall | 24.2 |
Average High
Days of Rain
Source: NOAA climate normals (30-year)
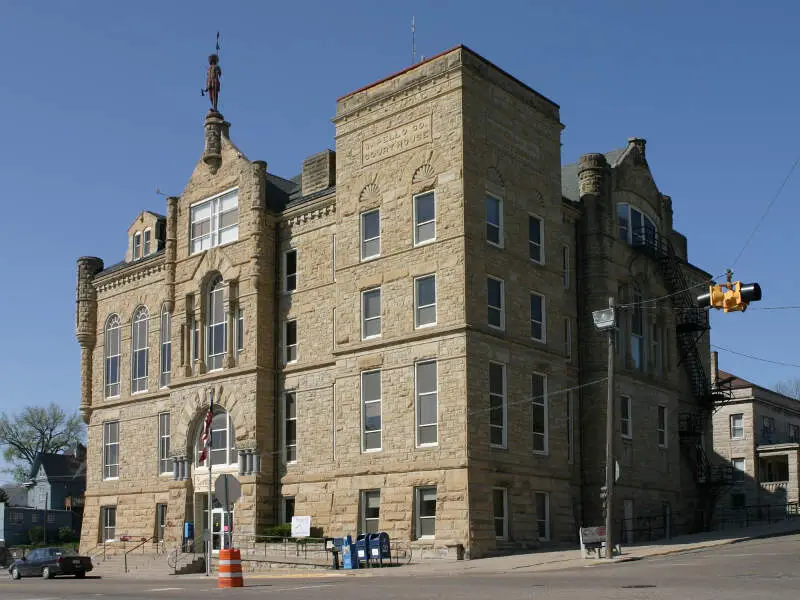
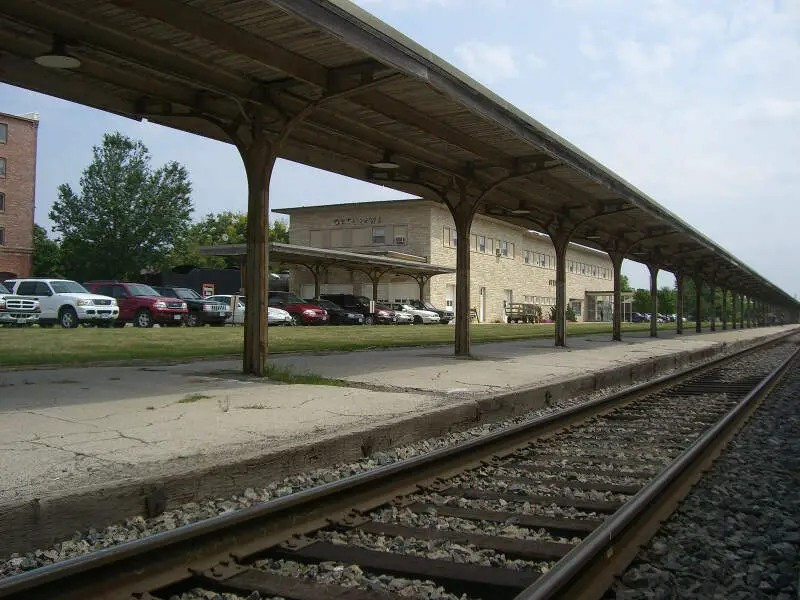
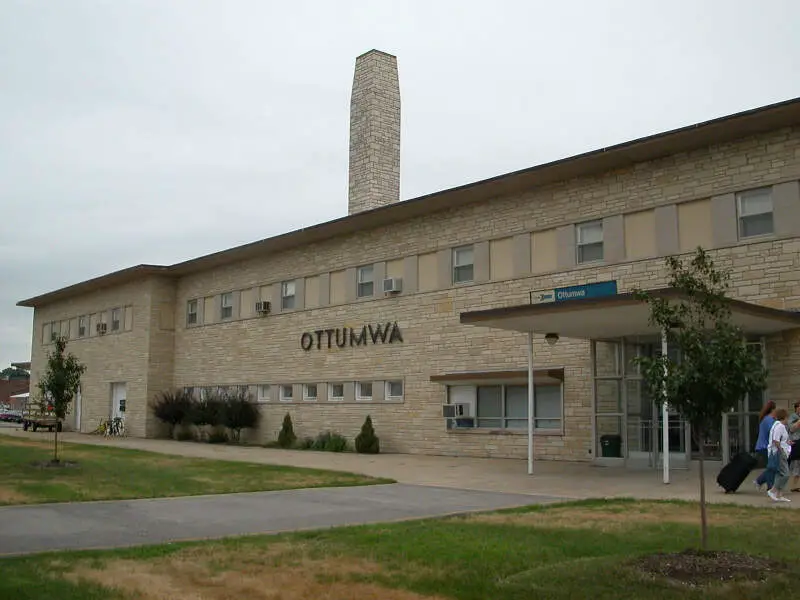
Ottumwa, IA Photos

3 Reviews & Comments About Ottumwa

I live in ottumwa and it s***s. 3 years of h**l here!!!
I know right i live in ottumwa and its so boring
Crime is on rise 4 shooting.... Home invasion. Robbery. Housing prices is all time high rent over 800 hundred dollars a month. Up to 1500$ a month. Businesses and landlords are discriminating against people get disability check. Won't help people I lost respect for ottumwa
Nothing stand out half business shutting down
Rankings & Articles For Ottumwa


Locations Around Ottumwa
Map Of Ottumwa, IA
Best Places Around Ottumwa
Washington, IA
Population 7,290
Pella, IA
Population 10,720
Fairfield, IA
Population 9,456
Knoxville, IA
Population 7,473
Oskaloosa, IA
Population 11,504
Mount Pleasant, IA
Population 8,951
Centerville, IA
Population 5,372
Ottumwa Demographics And Statistics
Population over time in Ottumwa
The current population in Ottumwa is 25,430. The population has increased 2.2% from 2010.
| Year | Population | % Change |
|---|---|---|
| 2024 | 25,430 | 0.3% |
| 2023 | 25,352 | -0.0% |
| 2022 | 25,359 | -0.1% |
| 2021 | 25,379 | 3.6% |
| 2020 | 24,505 | -0.2% |
| 2019 | 24,545 | -0.5% |
| 2018 | 24,676 | -0.1% |
| 2017 | 24,705 | -0.0% |
| 2016 | 24,709 | -0.2% |
| 2015 | 24,758 | -0.4% |
| 2014 | 24,847 | -0.2% |
| 2013 | 24,896 | 0.2% |
| 2012 | 24,849 | -0.1% |
| 2011 | 24,866 | -0.1% |
| 2010 | 24,889 | - |
Race / Ethnicity in Ottumwa
See the full breakdown
Ottumwa is:
69.0% White with 17,541 White residents.
4.0% African American with 1,023 African American residents.
0.0% American Indian with 7 American Indian residents.
2.3% Asian with 579 Asian residents.
3.4% Hawaiian with 857 Hawaiian residents.
0.2% Other with 54 Other residents.
4.0% Two Or More with 1,013 Two Or More residents.
17.1% Hispanic with 4,356 Hispanic residents.
| Race | Ottumwa | IA | USA |
|---|---|---|---|
| White | 69.0% | 82.3% | 57.4% |
| African American | 4.0% | 3.8% | 11.9% |
| American Indian | 0.0% | 0.2% | 0.5% |
| Asian | 2.3% | 2.5% | 5.9% |
| Hawaiian | 3.4% | 0.2% | 0.2% |
| Other | 0.2% | 0.3% | 0.6% |
| Two Or More | 4.0% | 3.5% | 4.3% |
| Hispanic | 17.1% | 7.3% | 19.3% |
Gender in Ottumwa
See the full breakdown
Ottumwa is 49.3% female with 12,544 female residents.
Ottumwa is 50.7% male with 12,885 male residents.
| Gender | Ottumwa | IA | USA |
|---|---|---|---|
| Female | 49.3% | 49.8% | 50.5% |
| Male | 50.7% | 50.2% | 49.5% |
Highest level of educational attainment in Ottumwa for adults over 25
See the full breakdown
7.0% of adults in Ottumwa completed < 9th grade.
6.0% of adults in Ottumwa completed 9-12th grade.
38.0% of adults in Ottumwa completed high school / ged.
18.0% of adults in Ottumwa completed some college.
10.0% of adults in Ottumwa completed associate's degree.
12.0% of adults in Ottumwa completed bachelor's degree.
7.0% of adults in Ottumwa completed master's degree.
1.0% of adults in Ottumwa completed professional degree.
1.0% of adults in Ottumwa completed doctorate degree.
| Education | Ottumwa | IA | USA |
|---|---|---|---|
| < 9th Grade | 7.0% | 3.0% | 4.0% |
| 9-12th Grade | 6.0% | 4.0% | 6.0% |
| High School / GED | 38.0% | 30.0% | 26.0% |
| Some College | 18.0% | 20.0% | 19.0% |
| Associate's Degree | 10.0% | 12.0% | 9.0% |
| Bachelor's Degree | 12.0% | 21.0% | 22.0% |
| Master's Degree | 7.0% | 7.0% | 10.0% |
| Professional Degree | 1.0% | 2.0% | 2.0% |
| Doctorate Degree | 1.0% | 1.0% | 2.0% |
Household Income For Ottumwa, Iowa
See the full breakdown
4.2% of households in Ottumwa earn Less than $10,000.
3.9% of households in Ottumwa earn $10,000 to $14,999.
11.2% of households in Ottumwa earn $15,000 to $24,999.
9.1% of households in Ottumwa earn $25,000 to $34,999.
10.8% of households in Ottumwa earn $35,000 to $49,999.
22.3% of households in Ottumwa earn $50,000 to $74,999.
14.4% of households in Ottumwa earn $75,000 to $99,999.
14.9% of households in Ottumwa earn $100,000 to $149,999.
6.2% of households in Ottumwa earn $150,000 to $199,999.
3.0% of households in Ottumwa earn $200,000 or more.
| Income | Ottumwa | IA | USA |
|---|---|---|---|
| Less than $10,000 | 4.2% | 4.0% | 5.0% |
| $10,000 to $14,999 | 3.9% | 3.2% | 3.4% |
| $15,000 to $24,999 | 11.2% | 6.7% | 6.3% |
| $25,000 to $34,999 | 9.1% | 7.2% | 6.6% |
| $35,000 to $49,999 | 10.8% | 11.3% | 10.1% |
| $50,000 to $74,999 | 22.3% | 17.5% | 15.5% |
| $75,000 to $99,999 | 14.4% | 14.0% | 12.6% |
| $100,000 to $149,999 | 14.9% | 18.7% | 17.5% |
| $150,000 to $199,999 | 6.2% | 8.8% | 9.6% |
| $200,000 or more | 3.0% | 8.6% | 13.4% |
Source: U.S. Census ACS 5-year estimates (2024)


