Clinton SnackAbility
Overall SnackAbility
Crime in Clinton summary. We use data from the FBI to determine the crime rates in Clinton. Key points include:
There were 746 total crimes in Clinton in the last reporting year.
The overall crime rate per 100,000 people in Clinton is 3,086.3 / 100k people.
The violent crime rate per 100,000 people in Clinton is 359.9 / 100k people.
The property crime rate per 100,000 people in Clinton is 2,726.4 / 100k people.
Overall, crime in Clinton is 45.63% above the national average.
Total Crimes
Above National Average
Crime In Clinton Comparison Table
| Statistic | Count Raw |
Clinton / 100k People |
Iowa / 100k People |
National / 100k People |
|---|---|---|---|---|
| Total Crimes Per 100K | 746 | 3,086.3 | 1,540.0 | 2,119.2 |
| Violent Crime | 87 | 359.9 | 243.3 | 359.0 |
| Murder | 0 | 0.0 | 2.1 | 5.0 |
| Robbery | 7 | 29.0 | 18.7 | 61.0 |
| Aggravated Assault | 64 | 264.8 | 187.2 | 256.0 |
| Property Crime | 659 | 2,726.4 | 1,296.8 | 1,760.0 |
| Burglary | 109 | 451.0 | 199.1 | 229.0 |
| Larceny | 500 | 2,068.6 | 962.6 | 1,272.0 |
| Car Theft | 50 | 206.9 | 135.1 | 259.0 |
Source: FBI Uniform Crime Reporting (2024)
Cost of living in Clinton summary. We use data on the cost of living to determine how expensive it is to live in Clinton. Real estate prices drive most of the variance in cost of living around Iowa. Key points include:
The cost of living in Clinton is 87 with 100 being average.
The cost of living in Clinton is 0.9x lower than the national average.
The median home value in Clinton is $127,331.
The median income in Clinton is $60,230.
Clinton's Overall Cost Of Living
Lower Than The National Average
Cost Of Living In Clinton Comparison Table
| Living Expense | Clinton | Iowa | National Average |
|---|---|---|---|
| Overall | 87 | 90 | 100 |
| Services | 98 | 99 | 100 |
| Groceries | 98 | 95 | 100 |
| Health | 61 | 75 | 100 |
| Housing | 96 | 97 | 100 |
| Transportation | 92 | 93 | 100 |
| Utilities | 94 | 94 | 100 |
Source: Cost of living index, normalized to US average = 100
Clinton, IA Weather
The average high in Clinton is 59.1° and the average low is 39.1°.
There are 61.7 days of precipitation each year.
Expect an average of 35.3 inches of precipitation each year with 30.5 inches of snow.
| Stat | Clinton |
|---|---|
| Average Annual High | 59.1 |
| Average Annual Low | 39.1 |
| Annual Precipitation Days | 61.7 |
| Average Annual Precipitation | 35.3 |
| Average Annual Snowfall | 30.5 |
Average High
Days of Rain
Source: NOAA climate normals (30-year)
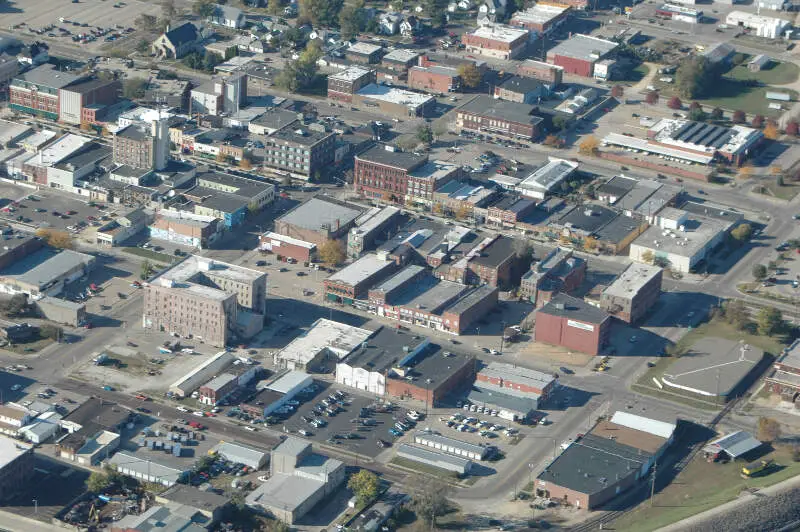
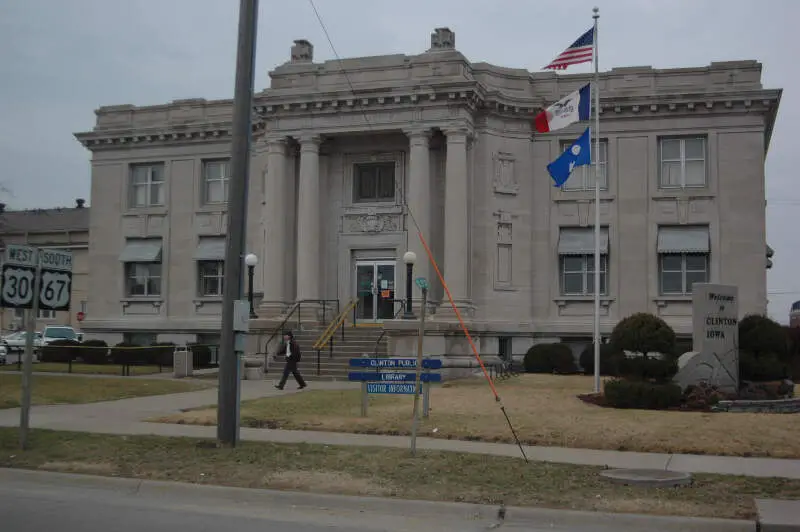
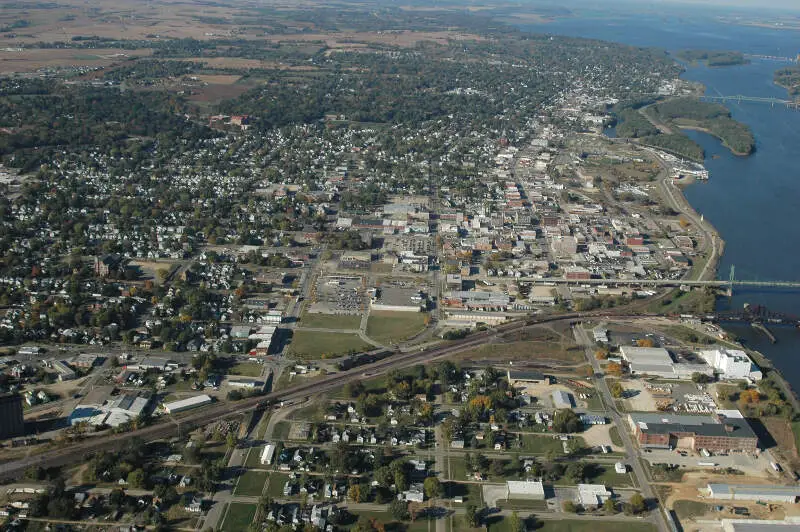
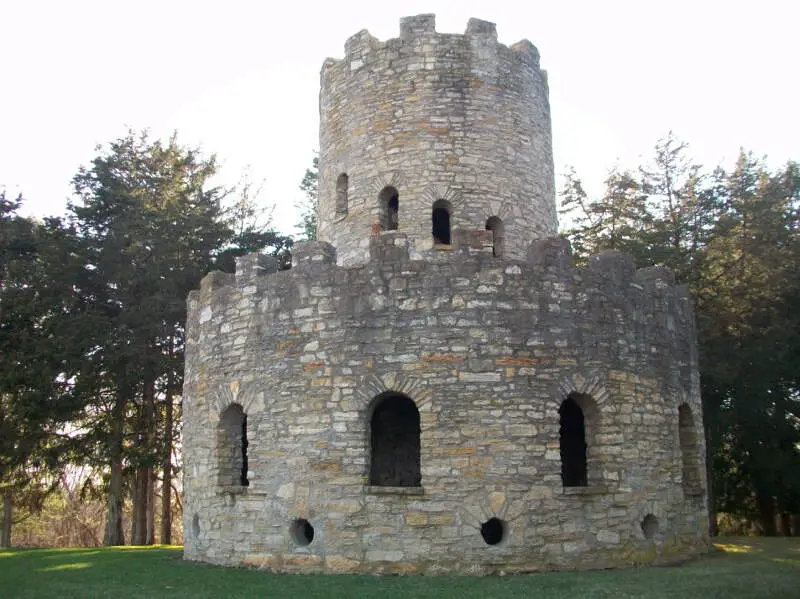
Clinton, IA Photos


1 Reviews & Comments About Clinton

I have lived in Clinton pretty much my whole life
Rankings & Articles For Clinton


Locations Around Clinton
Map Of Clinton, IA
Best Places Around Clinton
Geneseo, IL
Population 6,673
Moline, IL
Population 42,197
Colona, IL
Population 5,139
Silvis, IL
Population 7,955
Rock Falls, IL
Population 8,587
Rock Island, IL
Population 36,151
East Moline, IL
Population 20,904
Milan, IL
Population 5,034
Sterling, IL
Population 14,717
Dixon, IL
Population 14,910
Clinton Demographics And Statistics
Population over time in Clinton
The current population in Clinton is 24,322. The population has decreased 10.0% from 2010.
| Year | Population | % Change |
|---|---|---|
| 2024 | 24,322 | -0.4% |
| 2023 | 24,425 | -0.4% |
| 2022 | 24,524 | -0.5% |
| 2021 | 24,651 | -2.5% |
| 2020 | 25,290 | -0.5% |
| 2019 | 25,416 | -0.9% |
| 2018 | 25,637 | -1.0% |
| 2017 | 25,892 | -1.0% |
| 2016 | 26,148 | -1.0% |
| 2015 | 26,413 | -0.7% |
| 2014 | 26,611 | -0.5% |
| 2013 | 26,757 | -0.4% |
| 2012 | 26,877 | -0.3% |
| 2011 | 26,956 | -0.2% |
| 2010 | 27,016 | - |
Race / Ethnicity in Clinton
See the full breakdown
Clinton is:
85.6% White with 20,815 White residents.
5.3% African American with 1,290 African American residents.
0.2% American Indian with 38 American Indian residents.
0.5% Asian with 128 Asian residents.
0.0% Hawaiian with 0 Hawaiian residents.
0.2% Other with 51 Other residents.
3.4% Two Or More with 839 Two Or More residents.
4.8% Hispanic with 1,161 Hispanic residents.
| Race | Clinton | IA | USA |
|---|---|---|---|
| White | 85.6% | 82.3% | 57.4% |
| African American | 5.3% | 3.8% | 11.9% |
| American Indian | 0.2% | 0.2% | 0.5% |
| Asian | 0.5% | 2.5% | 5.9% |
| Hawaiian | 0.0% | 0.2% | 0.2% |
| Other | 0.2% | 0.3% | 0.6% |
| Two Or More | 3.4% | 3.5% | 4.3% |
| Hispanic | 4.8% | 7.3% | 19.3% |
Gender in Clinton
See the full breakdown
Clinton is 51.1% female with 12,426 female residents.
Clinton is 48.9% male with 11,895 male residents.
| Gender | Clinton | IA | USA |
|---|---|---|---|
| Female | 51.1% | 49.8% | 50.5% |
| Male | 48.9% | 50.2% | 49.5% |
Highest level of educational attainment in Clinton for adults over 25
See the full breakdown
2.0% of adults in Clinton completed < 9th grade.
8.0% of adults in Clinton completed 9-12th grade.
36.0% of adults in Clinton completed high school / ged.
22.0% of adults in Clinton completed some college.
11.0% of adults in Clinton completed associate's degree.
14.0% of adults in Clinton completed bachelor's degree.
5.0% of adults in Clinton completed master's degree.
1.0% of adults in Clinton completed professional degree.
1.0% of adults in Clinton completed doctorate degree.
| Education | Clinton | IA | USA |
|---|---|---|---|
| < 9th Grade | 2.0% | 3.0% | 4.0% |
| 9-12th Grade | 8.0% | 4.0% | 6.0% |
| High School / GED | 36.0% | 30.0% | 26.0% |
| Some College | 22.0% | 20.0% | 19.0% |
| Associate's Degree | 11.0% | 12.0% | 9.0% |
| Bachelor's Degree | 14.0% | 21.0% | 22.0% |
| Master's Degree | 5.0% | 7.0% | 10.0% |
| Professional Degree | 1.0% | 2.0% | 2.0% |
| Doctorate Degree | 1.0% | 1.0% | 2.0% |
Household Income For Clinton, Iowa
See the full breakdown
5.8% of households in Clinton earn Less than $10,000.
6.1% of households in Clinton earn $10,000 to $14,999.
9.2% of households in Clinton earn $15,000 to $24,999.
10.2% of households in Clinton earn $25,000 to $34,999.
12.2% of households in Clinton earn $35,000 to $49,999.
19.0% of households in Clinton earn $50,000 to $74,999.
12.7% of households in Clinton earn $75,000 to $99,999.
13.1% of households in Clinton earn $100,000 to $149,999.
7.2% of households in Clinton earn $150,000 to $199,999.
4.6% of households in Clinton earn $200,000 or more.
| Income | Clinton | IA | USA |
|---|---|---|---|
| Less than $10,000 | 5.8% | 4.0% | 5.0% |
| $10,000 to $14,999 | 6.1% | 3.2% | 3.4% |
| $15,000 to $24,999 | 9.2% | 6.7% | 6.3% |
| $25,000 to $34,999 | 10.2% | 7.2% | 6.6% |
| $35,000 to $49,999 | 12.2% | 11.3% | 10.1% |
| $50,000 to $74,999 | 19.0% | 17.5% | 15.5% |
| $75,000 to $99,999 | 12.7% | 14.0% | 12.6% |
| $100,000 to $149,999 | 13.1% | 18.7% | 17.5% |
| $150,000 to $199,999 | 7.2% | 8.8% | 9.6% |
| $200,000 or more | 4.6% | 8.6% | 13.4% |
Source: U.S. Census ACS 5-year estimates (2024)


