Geneseo SnackAbility
Overall SnackAbility
Cost of living in Geneseo summary. We use data on the cost of living to determine how expensive it is to live in Geneseo. Real estate prices drive most of the variance in cost of living around Illinois. Key points include:
The cost of living in Geneseo is 92 with 100 being average.
The cost of living in Geneseo is 0.9x lower than the national average.
The median home value in Geneseo is $238,661.
The median income in Geneseo is $70,147.
Geneseo's Overall Cost Of Living
Lower Than The National Average
Cost Of Living In Geneseo Comparison Table
| Living Expense | Geneseo | Illinois | National Average |
|---|---|---|---|
| Overall | 92 | 98 | 100 |
| Services | 95 | 99 | 100 |
| Groceries | 97 | 99 | 100 |
| Health | 88 | 96 | 100 |
| Housing | 97 | 101 | 100 |
| Transportation | 94 | 99 | 100 |
| Utilities | 94 | 101 | 100 |
Source: Cost of living index, normalized to US average = 100
Geneseo, IL Weather
The average high in Geneseo is 59.8° and the average low is 39.9°.
There are 68.2 days of precipitation each year.
Expect an average of 36.5 inches of precipitation each year with 25.7 inches of snow.
| Stat | Geneseo |
|---|---|
| Average Annual High | 59.8 |
| Average Annual Low | 39.9 |
| Annual Precipitation Days | 68.2 |
| Average Annual Precipitation | 36.5 |
| Average Annual Snowfall | 25.7 |
Average High
Days of Rain
Source: NOAA climate normals (30-year)
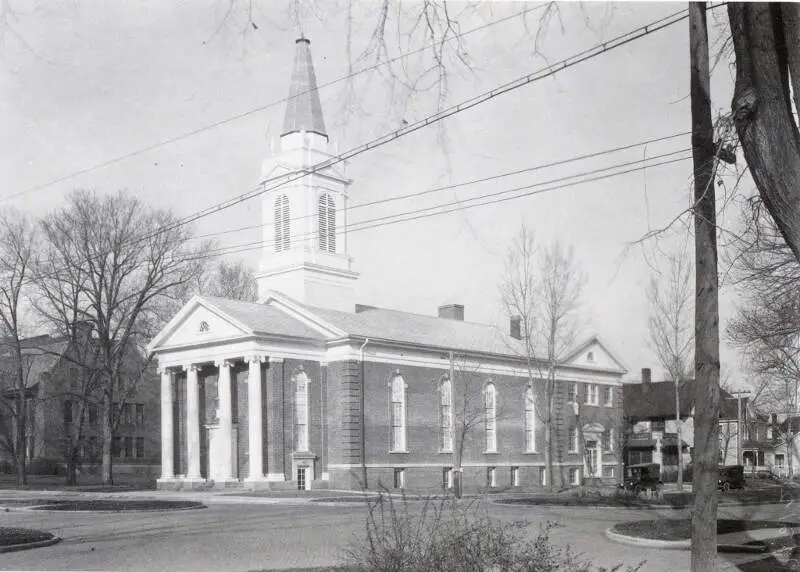
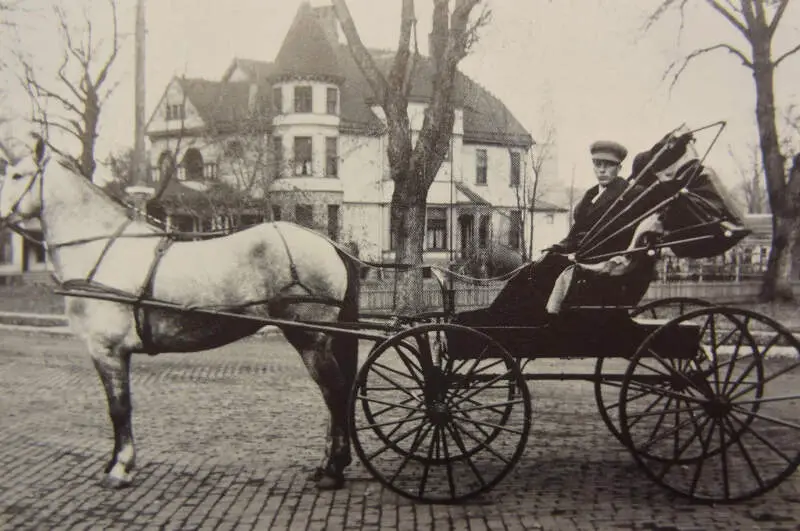
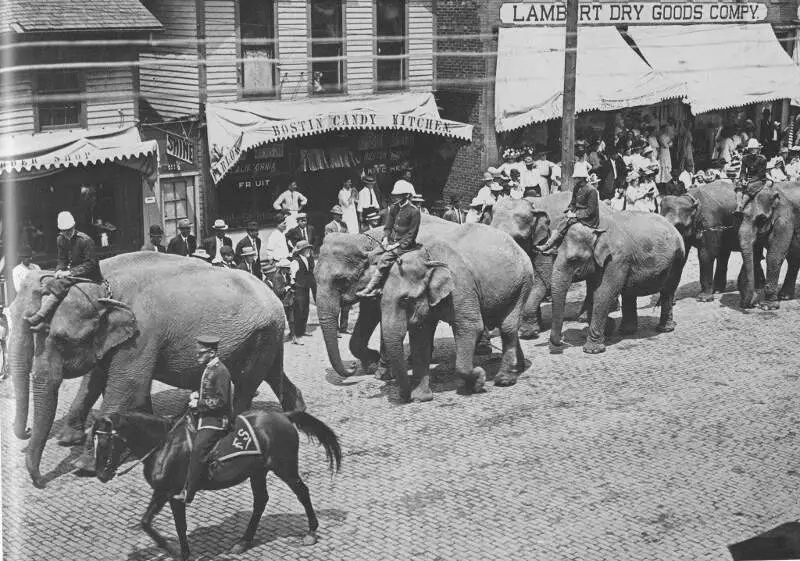
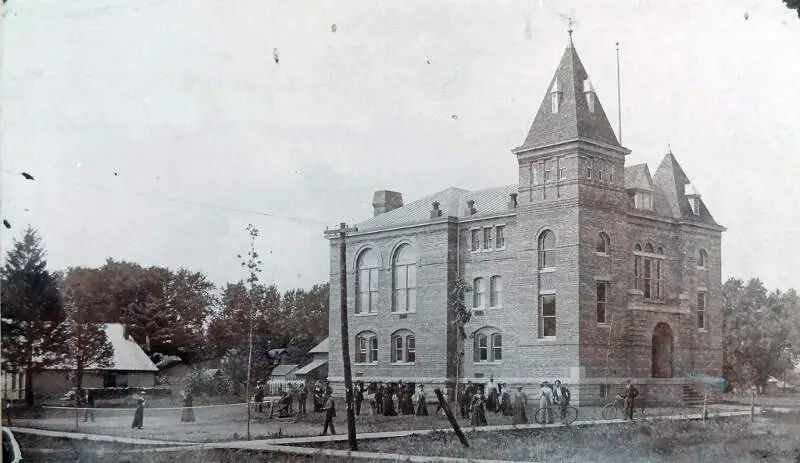
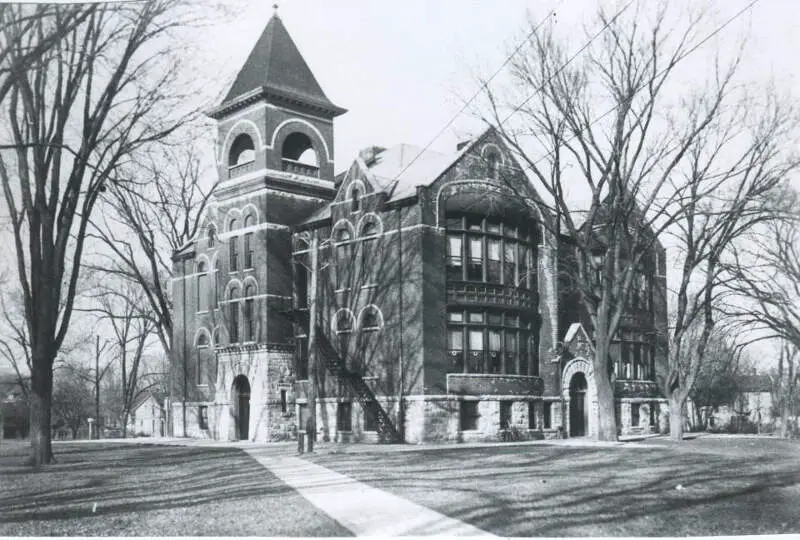
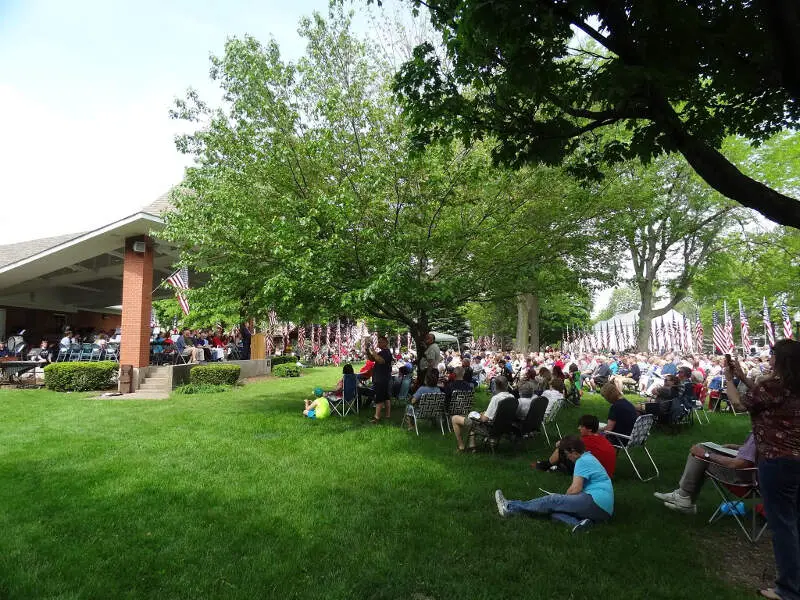
Geneseo, IL Photos

Rankings & Articles For Geneseo


Locations Around Geneseo
Map Of Geneseo, IL
Best Places Around Geneseo
Moline, IL
Population 42,197
Colona, IL
Population 5,139
Silvis, IL
Population 7,955
East Moline, IL
Population 20,904
Kewanee, IL
Population 11,913
Bettendorf, IA
Population 39,647
Geneseo Demographics And Statistics
Population over time in Geneseo
The current population in Geneseo is 6,673. The population has increased 3.0% from 2010.
| Year | Population | % Change |
|---|---|---|
| 2024 | 6,673 | 1.5% |
| 2023 | 6,577 | 2.4% |
| 2022 | 6,421 | -5.2% |
| 2021 | 6,774 | 3.2% |
| 2020 | 6,566 | -0.5% |
| 2019 | 6,599 | 1.2% |
| 2018 | 6,520 | -0.6% |
| 2017 | 6,557 | -0.5% |
| 2016 | 6,589 | 1.0% |
| 2015 | 6,523 | 0.4% |
| 2014 | 6,500 | -3.2% |
| 2013 | 6,717 | 1.7% |
| 2012 | 6,604 | 2.7% |
| 2011 | 6,432 | -0.7% |
| 2010 | 6,476 | - |
Race / Ethnicity in Geneseo
See the full breakdown
Geneseo is:
87.9% White with 5,868 White residents.
0.1% African American with 6 African American residents.
0.0% American Indian with 0 American Indian residents.
1.0% Asian with 67 Asian residents.
0.0% Hawaiian with 0 Hawaiian residents.
0.2% Other with 12 Other residents.
3.5% Two Or More with 234 Two Or More residents.
7.3% Hispanic with 486 Hispanic residents.
| Race | Geneseo | IL | USA |
|---|---|---|---|
| White | 87.9% | 58.1% | 57.4% |
| African American | 0.1% | 13.3% | 11.9% |
| American Indian | 0.0% | 0.1% | 0.5% |
| Asian | 1.0% | 5.9% | 5.9% |
| Hawaiian | 0.0% | 0.0% | 0.2% |
| Other | 0.2% | 0.4% | 0.6% |
| Two Or More | 3.5% | 3.4% | 4.3% |
| Hispanic | 7.3% | 18.8% | 19.3% |
Gender in Geneseo
See the full breakdown
Geneseo is 53.9% female with 3,600 female residents.
Geneseo is 46.1% male with 3,072 male residents.
| Gender | Geneseo | IL | USA |
|---|---|---|---|
| Female | 53.9% | 50.6% | 50.5% |
| Male | 46.1% | 49.4% | 49.5% |
Highest level of educational attainment in Geneseo for adults over 25
See the full breakdown
1.0% of adults in Geneseo completed < 9th grade.
3.0% of adults in Geneseo completed 9-12th grade.
29.0% of adults in Geneseo completed high school / ged.
24.0% of adults in Geneseo completed some college.
10.0% of adults in Geneseo completed associate's degree.
20.0% of adults in Geneseo completed bachelor's degree.
9.0% of adults in Geneseo completed master's degree.
3.0% of adults in Geneseo completed professional degree.
1.0% of adults in Geneseo completed doctorate degree.
| Education | Geneseo | IL | USA |
|---|---|---|---|
| < 9th Grade | 1.0% | 5.0% | 4.0% |
| 9-12th Grade | 3.0% | 5.0% | 6.0% |
| High School / GED | 29.0% | 25.0% | 26.0% |
| Some College | 24.0% | 19.0% | 19.0% |
| Associate's Degree | 10.0% | 8.0% | 9.0% |
| Bachelor's Degree | 20.0% | 23.0% | 22.0% |
| Master's Degree | 9.0% | 11.0% | 10.0% |
| Professional Degree | 3.0% | 2.0% | 2.0% |
| Doctorate Degree | 1.0% | 2.0% | 2.0% |
Household Income For Geneseo, Illinois
See the full breakdown
2.2% of households in Geneseo earn Less than $10,000.
0.6% of households in Geneseo earn $10,000 to $14,999.
5.2% of households in Geneseo earn $15,000 to $24,999.
8.8% of households in Geneseo earn $25,000 to $34,999.
18.3% of households in Geneseo earn $35,000 to $49,999.
17.3% of households in Geneseo earn $50,000 to $74,999.
7.7% of households in Geneseo earn $75,000 to $99,999.
21.1% of households in Geneseo earn $100,000 to $149,999.
9.7% of households in Geneseo earn $150,000 to $199,999.
8.9% of households in Geneseo earn $200,000 or more.
| Income | Geneseo | IL | USA |
|---|---|---|---|
| Less than $10,000 | 2.2% | 5.4% | 5.0% |
| $10,000 to $14,999 | 0.6% | 3.2% | 3.4% |
| $15,000 to $24,999 | 5.2% | 5.9% | 6.3% |
| $25,000 to $34,999 | 8.8% | 6.3% | 6.6% |
| $35,000 to $49,999 | 18.3% | 9.7% | 10.1% |
| $50,000 to $74,999 | 17.3% | 14.8% | 15.5% |
| $75,000 to $99,999 | 7.7% | 12.6% | 12.6% |
| $100,000 to $149,999 | 21.1% | 18.0% | 17.5% |
| $150,000 to $199,999 | 9.7% | 10.1% | 9.6% |
| $200,000 or more | 8.9% | 13.8% | 13.4% |
Source: U.S. Census ACS 5-year estimates (2024)


