Council Bluffs SnackAbility
Overall SnackAbility
Crime in Council Bluffs summary. We use data from the FBI to determine the crime rates in Council Bluffs. Key points include:
There were 1,789 total crimes in Council Bluffs in the last reporting year.
The overall crime rate per 100,000 people in Council Bluffs is 2,873.0 / 100k people.
The violent crime rate per 100,000 people in Council Bluffs is 420.8 / 100k people.
The property crime rate per 100,000 people in Council Bluffs is 2,452.3 / 100k people.
Overall, crime in Council Bluffs is 35.57% above the national average.
Total Crimes
Above National Average
Crime In Council Bluffs Comparison Table
| Statistic | Count Raw |
Council Bluffs / 100k People |
Iowa / 100k People |
National / 100k People |
|---|---|---|---|---|
| Total Crimes Per 100K | 1,789 | 2,873.0 | 1,540.0 | 2,119.2 |
| Violent Crime | 262 | 420.8 | 243.3 | 359.0 |
| Murder | 2 | 3.2 | 2.1 | 5.0 |
| Robbery | 44 | 70.7 | 18.7 | 61.0 |
| Aggravated Assault | 171 | 274.6 | 187.2 | 256.0 |
| Property Crime | 1,527 | 2,452.3 | 1,296.8 | 1,760.0 |
| Burglary | 303 | 486.6 | 199.1 | 229.0 |
| Larceny | 1,018 | 1,634.8 | 962.6 | 1,272.0 |
| Car Theft | 206 | 330.8 | 135.1 | 259.0 |
Source: FBI Uniform Crime Reporting (2024)
Cost of living in Council Bluffs summary. We use data on the cost of living to determine how expensive it is to live in Council Bluffs. Real estate prices drive most of the variance in cost of living around Iowa. Key points include:
The cost of living in Council Bluffs is 88 with 100 being average.
The cost of living in Council Bluffs is 0.9x lower than the national average.
The median home value in Council Bluffs is $223,906.
The median income in Council Bluffs is $64,578.
Council Bluffs's Overall Cost Of Living
Lower Than The National Average
Cost Of Living In Council Bluffs Comparison Table
| Living Expense | Council Bluffs | Iowa | National Average |
|---|---|---|---|
| Overall | 88 | 90 | 100 |
| Services | 101 | 99 | 100 |
| Groceries | 95 | 95 | 100 |
| Health | 75 | 75 | 100 |
| Housing | 100 | 97 | 100 |
| Transportation | 98 | 93 | 100 |
| Utilities | 98 | 94 | 100 |
Source: Cost of living index, normalized to US average = 100
Council Bluffs, IA Weather
The average high in Council Bluffs is 61.6° and the average low is 40.2°.
There are 57.5 days of precipitation each year.
Expect an average of 32.2 inches of precipitation each year with 26.2 inches of snow.
| Stat | Council Bluffs |
|---|---|
| Average Annual High | 61.6 |
| Average Annual Low | 40.2 |
| Annual Precipitation Days | 57.5 |
| Average Annual Precipitation | 32.2 |
| Average Annual Snowfall | 26.2 |
Average High
Days of Rain
Source: NOAA climate normals (30-year)
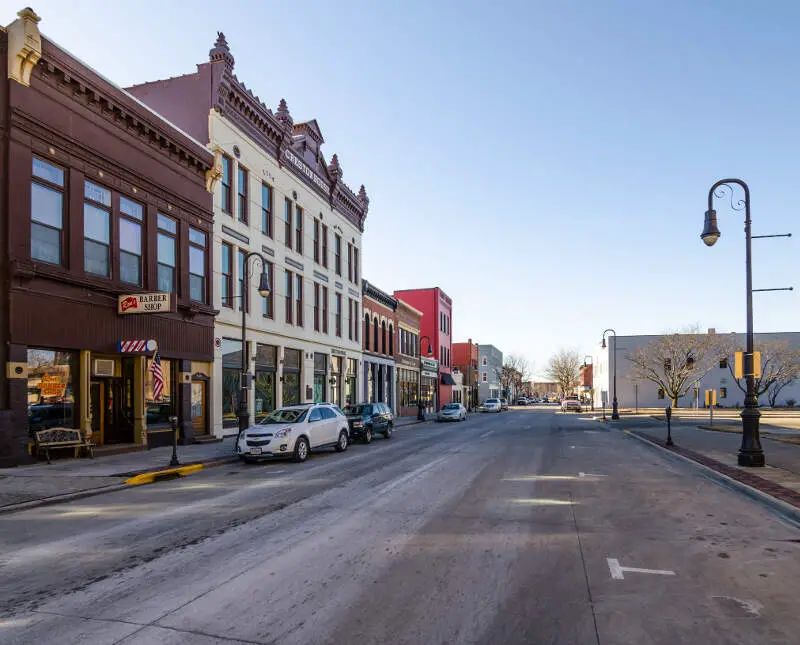
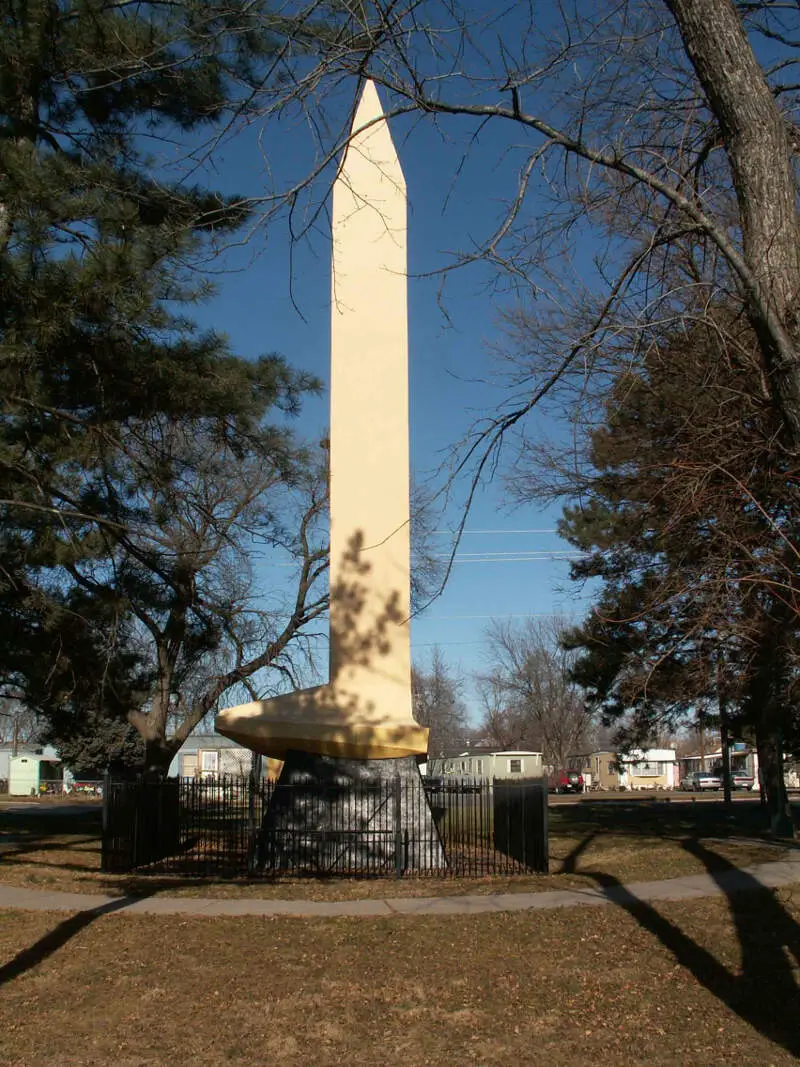
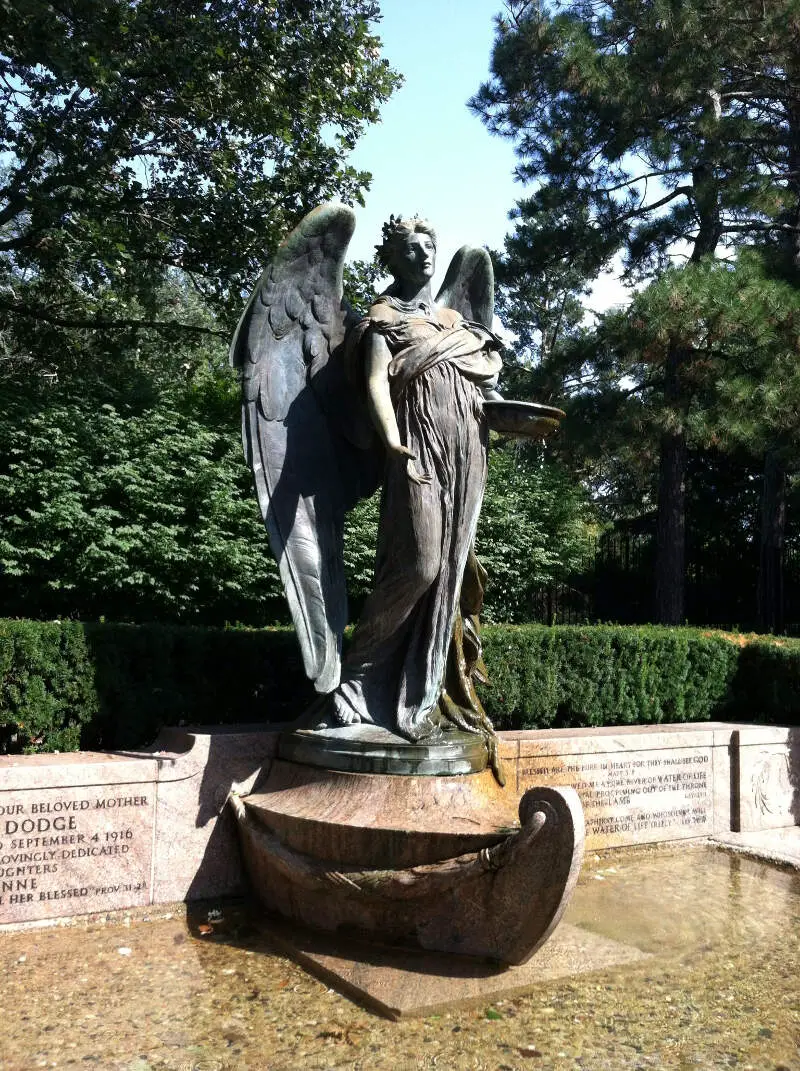
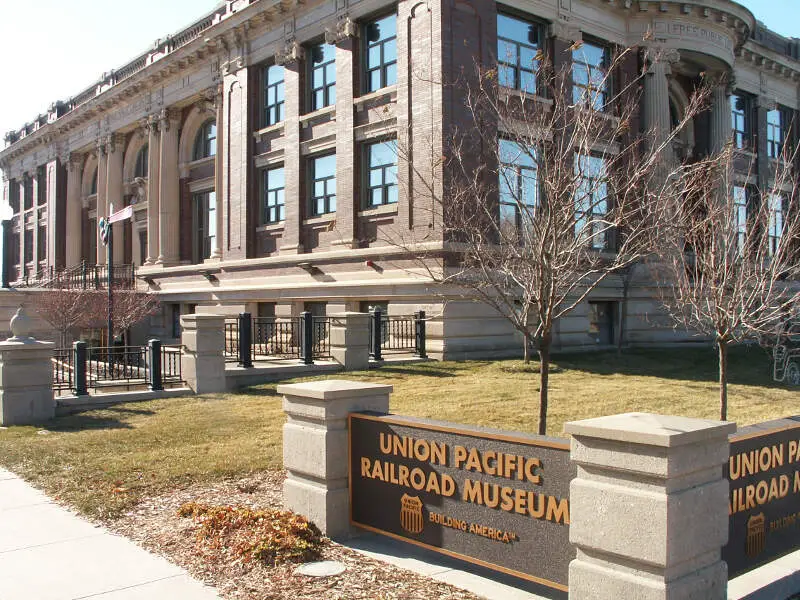
Council Bluffs, IA Photos
9 Reviews & Comments About Council Bluffs

I've lived in Council Bluffs most of my life, and it's really not that bad anymore.
Also, people here don't 'get iced'. If someone doesn't like you here, they'll usually either talk s**t or try to get one of their friends to start trouble with you.
There are alot of m**h heads, but alot of the m**h comes from the surrounding tiny towns that aren't even listed.
Most of those people in town don't want anything to get in the way of their lifestyle, so alot of them learned to stay more off the radar and avoid things that would get the cops on their a***s.
There is alot of 'Blue Lives Matter' s**t here though, and alot of pro-life bumper stickers, but if you don't roll with the consevative crowds you can always hop the interstate bridge to Omaha--lots of artsy, progressive neighborhoods. But on our side, you do have to put effort into getting into trouble most of the time here. It's not commonly a thing that just happens to you if you're walking down just any street!
I lived in cb Iowa for 4 flipping years... and it was horrible... I didnt mind that it was 24 7 in some places prefered to shop at night... otherwise the tweakers were everywhere and the crime was outrageous... I dont know how much we lost due to them just walking up and stealing s**t of our porchs enclosed back porch and open front porch... a very large bag of my friends and my kids clothes that took us hours to wash at a local laundromat was stolen around christmas time off my back porch... bikes stolen one recovered one custom bike not recovered... very recognizable and was caufht on video but werent avle to save it to give to police... constant police sirens, accidents, shootings, there are good things about it but not many... I finally got away from there and there's nothing in this world that could ever make me go back...
I live in Council Bluffs and to be honest, I'm extremely surprised that it's on a worst city list. He's making it out to be a lot more dangerous than it is.
Most of the city is fine. There are a couple of bad neighborhoods, but not anymore than any other city. Most of the gang activity is actually in the neighboring Nebraskan city of Omaha. Schools are pretty good. Council Bluffs is actually fairly quiet in my experiences, and I come from a lower income family.
I live in council bluffs for most of my life and I was surprised that it was no.1 on the list. He got pictures that made it look dirty and plain looking. It's actually nice here and my town is peaceful.
i live in council bluffs and it is NOT what they just described it as. they made it sound like everyone's poor and in a gang. there are few places that are poor areas.
I so agree with you on Council Bluffs.i was born and raised there and got bad in the mid 1990's.Omaha,Nebraska made it that way with drugs and crime at its all time high...
I lived in Council Bluffs for awhile and it indeed s***s. We call it Council-tucky. Interestingly enough, my brother lives in Storm Lake and my sister used to live in Clinton :)
I lived in Council Bluffs for two years. If you wanted something nice, you drove 10 minuets to Omaha. Really wasn't as bad as I thought it was going to be.
I live in council bluffs and it seems pretty fine to me.
Rankings & Articles For Council Bluffs


Locations Around Council Bluffs
Map Of Council Bluffs, IA
Best Places Around Council Bluffs
Papillion, NE
Population 25,244
Chalco, NE
Population 10,595
Ralston, NE
Population 6,472
Plattsmouth, NE
Population 6,731
Bellevue, NE
Population 64,510
Glenwood, IA
Population 5,144
Omaha, NE
Population 488,837
Council Bluffs Demographics And Statistics
Population over time in Council Bluffs
The current population in Council Bluffs is 62,586. The population has increased 2.0% from 2010.
| Year | Population | % Change |
|---|---|---|
| 2024 | 62,586 | 0.0% |
| 2023 | 62,564 | -0.2% |
| 2022 | 62,670 | 0.1% |
| 2021 | 62,617 | 0.4% |
| 2020 | 62,376 | 0.0% |
| 2019 | 62,355 | -0.2% |
| 2018 | 62,478 | 0.3% |
| 2017 | 62,317 | -0.0% |
| 2016 | 62,326 | 0.0% |
| 2015 | 62,309 | 0.1% |
| 2014 | 62,261 | 0.3% |
| 2013 | 62,094 | 0.2% |
| 2012 | 61,986 | 0.4% |
| 2011 | 61,740 | 0.7% |
| 2010 | 61,340 | - |
Race / Ethnicity in Council Bluffs
See the full breakdown
Council Bluffs is:
81.2% White with 50,840 White residents.
2.7% African American with 1,671 African American residents.
0.3% American Indian with 171 American Indian residents.
1.1% Asian with 675 Asian residents.
0.1% Hawaiian with 77 Hawaiian residents.
0.2% Other with 128 Other residents.
2.8% Two Or More with 1,780 Two Or More residents.
11.6% Hispanic with 7,244 Hispanic residents.
| Race | Council Bluffs | IA | USA |
|---|---|---|---|
| White | 81.2% | 82.3% | 57.4% |
| African American | 2.7% | 3.8% | 11.9% |
| American Indian | 0.3% | 0.2% | 0.5% |
| Asian | 1.1% | 2.5% | 5.9% |
| Hawaiian | 0.1% | 0.2% | 0.2% |
| Other | 0.2% | 0.3% | 0.6% |
| Two Or More | 2.8% | 3.5% | 4.3% |
| Hispanic | 11.6% | 7.3% | 19.3% |
Gender in Council Bluffs
See the full breakdown
Council Bluffs is 51.3% female with 32,128 female residents.
Council Bluffs is 48.7% male with 30,457 male residents.
| Gender | Council Bluffs | IA | USA |
|---|---|---|---|
| Female | 51.3% | 49.8% | 50.5% |
| Male | 48.7% | 50.2% | 49.5% |
Highest level of educational attainment in Council Bluffs for adults over 25
See the full breakdown
4.0% of adults in Council Bluffs completed < 9th grade.
8.0% of adults in Council Bluffs completed 9-12th grade.
35.0% of adults in Council Bluffs completed high school / ged.
21.0% of adults in Council Bluffs completed some college.
11.0% of adults in Council Bluffs completed associate's degree.
14.0% of adults in Council Bluffs completed bachelor's degree.
5.0% of adults in Council Bluffs completed master's degree.
1.0% of adults in Council Bluffs completed professional degree.
1.0% of adults in Council Bluffs completed doctorate degree.
| Education | Council Bluffs | IA | USA |
|---|---|---|---|
| < 9th Grade | 4.0% | 3.0% | 4.0% |
| 9-12th Grade | 8.0% | 4.0% | 6.0% |
| High School / GED | 35.0% | 30.0% | 26.0% |
| Some College | 21.0% | 20.0% | 19.0% |
| Associate's Degree | 11.0% | 12.0% | 9.0% |
| Bachelor's Degree | 14.0% | 21.0% | 22.0% |
| Master's Degree | 5.0% | 7.0% | 10.0% |
| Professional Degree | 1.0% | 2.0% | 2.0% |
| Doctorate Degree | 1.0% | 1.0% | 2.0% |
Household Income For Council Bluffs, Iowa
See the full breakdown
5.1% of households in Council Bluffs earn Less than $10,000.
4.0% of households in Council Bluffs earn $10,000 to $14,999.
9.3% of households in Council Bluffs earn $15,000 to $24,999.
7.2% of households in Council Bluffs earn $25,000 to $34,999.
12.9% of households in Council Bluffs earn $35,000 to $49,999.
18.5% of households in Council Bluffs earn $50,000 to $74,999.
14.5% of households in Council Bluffs earn $75,000 to $99,999.
17.0% of households in Council Bluffs earn $100,000 to $149,999.
7.3% of households in Council Bluffs earn $150,000 to $199,999.
4.1% of households in Council Bluffs earn $200,000 or more.
| Income | Council Bluffs | IA | USA |
|---|---|---|---|
| Less than $10,000 | 5.1% | 4.0% | 5.0% |
| $10,000 to $14,999 | 4.0% | 3.2% | 3.4% |
| $15,000 to $24,999 | 9.3% | 6.7% | 6.3% |
| $25,000 to $34,999 | 7.2% | 7.2% | 6.6% |
| $35,000 to $49,999 | 12.9% | 11.3% | 10.1% |
| $50,000 to $74,999 | 18.5% | 17.5% | 15.5% |
| $75,000 to $99,999 | 14.5% | 14.0% | 12.6% |
| $100,000 to $149,999 | 17.0% | 18.7% | 17.5% |
| $150,000 to $199,999 | 7.3% | 8.8% | 9.6% |
| $200,000 or more | 4.1% | 8.6% | 13.4% |
Source: U.S. Census ACS 5-year estimates (2024)


