Maquoketa SnackAbility
Overall SnackAbility
Crime in Maquoketa summary. We use data from the FBI to determine the crime rates in Maquoketa. Key points include:
There were 135 total crimes in Maquoketa in the last reporting year.
The overall crime rate per 100,000 people in Maquoketa is 2,239.2 / 100k people.
The violent crime rate per 100,000 people in Maquoketa is 248.8 / 100k people.
The property crime rate per 100,000 people in Maquoketa is 1,990.4 / 100k people.
Overall, crime in Maquoketa is 5.66% above the national average.
Total Crimes
Above National Average
Crime In Maquoketa Comparison Table
| Statistic | Count Raw |
Maquoketa / 100k People |
Iowa / 100k People |
National / 100k People |
|---|---|---|---|---|
| Total Crimes Per 100K | 135 | 2,239.2 | 1,540.0 | 2,119.2 |
| Violent Crime | 15 | 248.8 | 243.3 | 359.0 |
| Murder | 0 | 0.0 | 2.1 | 5.0 |
| Robbery | 0 | 0.0 | 18.7 | 61.0 |
| Aggravated Assault | 15 | 248.8 | 187.2 | 256.0 |
| Property Crime | 120 | 1,990.4 | 1,296.8 | 1,760.0 |
| Burglary | 25 | 414.7 | 199.1 | 229.0 |
| Larceny | 91 | 1,509.4 | 962.6 | 1,272.0 |
| Car Theft | 4 | 66.3 | 135.1 | 259.0 |
Source: FBI Uniform Crime Reporting (2024)
Cost of living in Maquoketa summary. We use data on the cost of living to determine how expensive it is to live in Maquoketa. Real estate prices drive most of the variance in cost of living around Iowa. Key points include:
The cost of living in Maquoketa is 81 with 100 being average.
The cost of living in Maquoketa is 0.8x lower than the national average.
The median home value in Maquoketa is $197,794.
The median income in Maquoketa is $60,240.
Maquoketa's Overall Cost Of Living
Lower Than The National Average
Cost Of Living In Maquoketa Comparison Table
| Living Expense | Maquoketa | Iowa | National Average |
|---|---|---|---|
| Overall | 81 | 90 | 100 |
| Services | 99 | 99 | 100 |
| Groceries | 97 | 95 | 100 |
| Health | 51 | 75 | 100 |
| Housing | 97 | 97 | 100 |
| Transportation | 92 | 93 | 100 |
| Utilities | 98 | 94 | 100 |
Source: Cost of living index, normalized to US average = 100
Maquoketa, IA Weather
The average high in Maquoketa is 58.4° and the average low is 37.9°.
There are 68.0 days of precipitation each year.
Expect an average of 35.7 inches of precipitation each year with 28.5 inches of snow.
| Stat | Maquoketa |
|---|---|
| Average Annual High | 58.4 |
| Average Annual Low | 37.9 |
| Annual Precipitation Days | 68.0 |
| Average Annual Precipitation | 35.7 |
| Average Annual Snowfall | 28.5 |
Average High
Days of Rain
Source: NOAA climate normals (30-year)
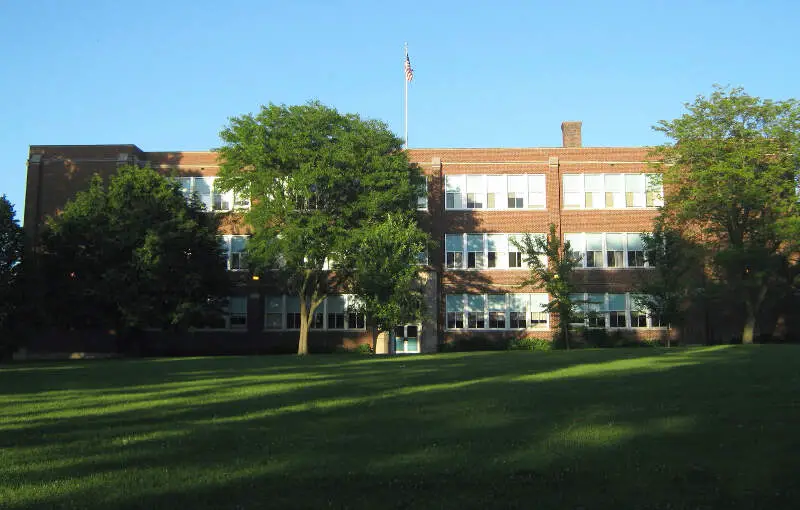
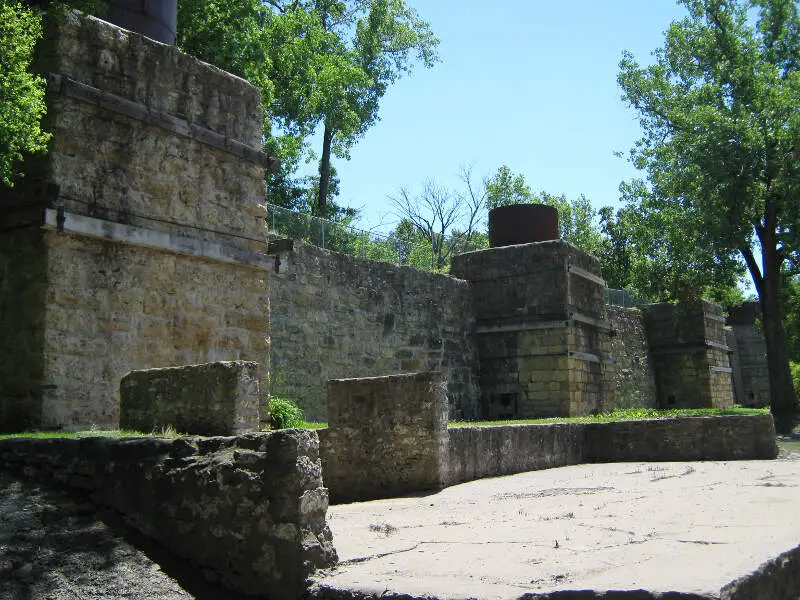
Maquoketa, IA Photos
3 Reviews & Comments About Maquoketa

I am proud to have lived in Maquoketa all my life.I can think of lots of other towns in Iowa that I wouldn't spend a single night in.
Maquoketa: Most boring, #14 on crime, #7 in unemployment, and poorest in State of Iowa. This based on only the small cities. It is more economical for me to live there, that is why I moved to Maquoketa. I am helping their economy by buying locally my groceries, household goods, etc. and hiring locals to fix up my place and maintain my lawn. Maquoketa population is a little over 6k. However, it now has a fine arts center and one of the best fairs in the State.
They never mentioned how friendly the people are and I have gotten to know quite a few. They have a newer Walmart, Fareway, True Value, Kwik Star, and Comfort Inn. If the poorest people in the State, then how can they think they could support all these establishments- Maquoketa Caves is also one of the most popular parks in the State!
I live in Maquoketa and I can confirm this is 100% true. Surprised Maquoketa isn't higher.
Rankings & Articles For Maquoketa


Locations Around Maquoketa
Map Of Maquoketa, IA
Best Places Around Maquoketa
Geneseo, IL
Population 6,673
Moline, IL
Population 42,197
Colona, IL
Population 5,139
Silvis, IL
Population 7,955
Rock Island, IL
Population 36,151
East Moline, IL
Population 20,904
Milan, IL
Population 5,034
Marion, IA
Population 41,896
Bettendorf, IA
Population 39,647
Platteville, WI
Population 11,499
Maquoketa Demographics And Statistics
Population over time in Maquoketa
The current population in Maquoketa is 6,075. The population has decreased 1.0% from 2010.
| Year | Population | % Change |
|---|---|---|
| 2024 | 6,075 | -0.5% |
| 2023 | 6,105 | -0.3% |
| 2022 | 6,123 | 0.0% |
| 2021 | 6,123 | 2.2% |
| 2020 | 5,990 | -0.3% |
| 2019 | 6,010 | -0.3% |
| 2018 | 6,026 | 1.2% |
| 2017 | 5,954 | -1.2% |
| 2016 | 6,025 | -0.1% |
| 2015 | 6,029 | -0.6% |
| 2014 | 6,064 | -0.6% |
| 2013 | 6,100 | -0.2% |
| 2012 | 6,113 | -0.3% |
| 2011 | 6,130 | -0.1% |
| 2010 | 6,135 | - |
Race / Ethnicity in Maquoketa
See the full breakdown
Maquoketa is:
89.5% White with 5,437 White residents.
2.3% African American with 142 African American residents.
0.0% American Indian with 1 American Indian residents.
0.0% Asian with 0 Asian residents.
1.5% Hawaiian with 90 Hawaiian residents.
0.5% Other with 33 Other residents.
5.1% Two Or More with 311 Two Or More residents.
1.0% Hispanic with 61 Hispanic residents.
| Race | Maquoketa | IA | USA |
|---|---|---|---|
| White | 89.5% | 82.3% | 57.4% |
| African American | 2.3% | 3.8% | 11.9% |
| American Indian | 0.0% | 0.2% | 0.5% |
| Asian | 0.0% | 2.5% | 5.9% |
| Hawaiian | 1.5% | 0.2% | 0.2% |
| Other | 0.5% | 0.3% | 0.6% |
| Two Or More | 5.1% | 3.5% | 4.3% |
| Hispanic | 1.0% | 7.3% | 19.3% |
Gender in Maquoketa
See the full breakdown
Maquoketa is 50.0% female with 3,040 female residents.
Maquoketa is 50.0% male with 3,035 male residents.
| Gender | Maquoketa | IA | USA |
|---|---|---|---|
| Female | 50.0% | 49.8% | 50.5% |
| Male | 50.0% | 50.2% | 49.5% |
Highest level of educational attainment in Maquoketa for adults over 25
See the full breakdown
2.0% of adults in Maquoketa completed < 9th grade.
2.0% of adults in Maquoketa completed 9-12th grade.
45.0% of adults in Maquoketa completed high school / ged.
22.0% of adults in Maquoketa completed some college.
9.0% of adults in Maquoketa completed associate's degree.
14.0% of adults in Maquoketa completed bachelor's degree.
5.0% of adults in Maquoketa completed master's degree.
1.0% of adults in Maquoketa completed professional degree.
0.0% of adults in Maquoketa completed doctorate degree.
| Education | Maquoketa | IA | USA |
|---|---|---|---|
| < 9th Grade | 2.0% | 3.0% | 4.0% |
| 9-12th Grade | 2.0% | 4.0% | 6.0% |
| High School / GED | 45.0% | 30.0% | 26.0% |
| Some College | 22.0% | 20.0% | 19.0% |
| Associate's Degree | 9.0% | 12.0% | 9.0% |
| Bachelor's Degree | 14.0% | 21.0% | 22.0% |
| Master's Degree | 5.0% | 7.0% | 10.0% |
| Professional Degree | 1.0% | 2.0% | 2.0% |
| Doctorate Degree | 0.0% | 1.0% | 2.0% |
Household Income For Maquoketa, Iowa
See the full breakdown
5.7% of households in Maquoketa earn Less than $10,000.
3.4% of households in Maquoketa earn $10,000 to $14,999.
7.9% of households in Maquoketa earn $15,000 to $24,999.
5.2% of households in Maquoketa earn $25,000 to $34,999.
19.1% of households in Maquoketa earn $35,000 to $49,999.
18.2% of households in Maquoketa earn $50,000 to $74,999.
16.9% of households in Maquoketa earn $75,000 to $99,999.
13.0% of households in Maquoketa earn $100,000 to $149,999.
7.3% of households in Maquoketa earn $150,000 to $199,999.
3.1% of households in Maquoketa earn $200,000 or more.
| Income | Maquoketa | IA | USA |
|---|---|---|---|
| Less than $10,000 | 5.7% | 4.0% | 5.0% |
| $10,000 to $14,999 | 3.4% | 3.2% | 3.4% |
| $15,000 to $24,999 | 7.9% | 6.7% | 6.3% |
| $25,000 to $34,999 | 5.2% | 7.2% | 6.6% |
| $35,000 to $49,999 | 19.1% | 11.3% | 10.1% |
| $50,000 to $74,999 | 18.2% | 17.5% | 15.5% |
| $75,000 to $99,999 | 16.9% | 14.0% | 12.6% |
| $100,000 to $149,999 | 13.0% | 18.7% | 17.5% |
| $150,000 to $199,999 | 7.3% | 8.8% | 9.6% |
| $200,000 or more | 3.1% | 8.6% | 13.4% |
Source: U.S. Census ACS 5-year estimates (2024)


