Waterloo, IA
Demographics And Statistics
Living In Waterloo, Iowa Summary
Life in Waterloo research summary. HomeSnacks has been using Saturday Night Science to research the quality of life in Waterloo over the past nine years using Census, FBI, Zillow, and other primary data sources. Based on the most recently available data, we found the following about life in Waterloo:
The population in Waterloo is 66,947.
The median home value in Waterloo is $147,023.
The median income in Waterloo is $56,344.
The cost of living in Waterloo is 83 which is 0.8x lower than the national average.
The median rent in Waterloo is $896.
The unemployment rate in Waterloo is 6.4%.
The poverty rate in Waterloo is 16.4%.
The average high in Waterloo is 57.5° and the average low is 37.1°.
Waterloo SnackAbility
Overall SnackAbility
Waterloo, IA Crime Report
Crime in Waterloo summary. We use data from the FBI to determine the crime rates in Waterloo. Key points include:
There were 1,939 total crimes in Waterloo in the last reporting year.
The overall crime rate per 100,000 people in Waterloo is 2,920.8 / 100k people.
The violent crime rate per 100,000 people in Waterloo is 476.0 / 100k people.
The property crime rate per 100,000 people in Waterloo is 2,444.8 / 100k people.
Overall, crime in Waterloo is 37.83% above the national average.
Total Crimes
Above National Average
Crime In Waterloo Comparison Table
| Statistic | Count Raw |
Waterloo / 100k People |
Iowa / 100k People |
National / 100k People |
|---|---|---|---|---|
| Total Crimes Per 100K | 1,939 | 2,920.8 | 1,540.0 | 2,119.2 |
| Violent Crime | 316 | 476.0 | 243.3 | 359.0 |
| Murder | 3 | 4.5 | 2.1 | 5.0 |
| Robbery | 23 | 34.6 | 18.7 | 61.0 |
| Aggravated Assault | 264 | 397.7 | 187.2 | 256.0 |
| Property Crime | 1,623 | 2,444.8 | 1,296.8 | 1,760.0 |
| Burglary | 389 | 586.0 | 199.1 | 229.0 |
| Larceny | 1,101 | 1,658.5 | 962.6 | 1,272.0 |
| Car Theft | 133 | 200.3 | 135.1 | 259.0 |
Waterloo, IA Cost Of Living
Cost of living in Waterloo summary. We use data on the cost of living to determine how expensive it is to live in Waterloo. Real estate prices drive most of the variance in cost of living around Iowa. Key points include:
The cost of living in Waterloo is 83 with 100 being average.
The cost of living in Waterloo is 0.8x lower than the national average.
The median home value in Waterloo is $147,023.
The median income in Waterloo is $56,344.
Waterloo's Overall Cost Of Living
Lower Than The National Average
Cost Of Living In Waterloo Comparison Table
| Living Expense | Waterloo | Iowa | National Average | |
|---|---|---|---|---|
| Overall | 83 | 90 | 100 | |
| Services | 83 | 96 | 100 | |
| Groceries | 93 | 97 | 100 | |
| Health | 100 | 99 | 100 | |
| Housing | 70 | 75 | 100 | |
| Transportation | 97 | 99 | 100 | |
| Utilities | 85 | 94 | 100 | |
Waterloo, IA Weather
The average high in Waterloo is 57.5° and the average low is 37.1°.
There are 63.6 days of precipitation each year.
Expect an average of 35.3 inches of precipitation each year with 34.4 inches of snow.
| Stat | Waterloo |
|---|---|
| Average Annual High | 57.5 |
| Average Annual Low | 37.1 |
| Annual Precipitation Days | 63.6 |
| Average Annual Precipitation | 35.3 |
| Average Annual Snowfall | 34.4 |
Average High
Days of Rain
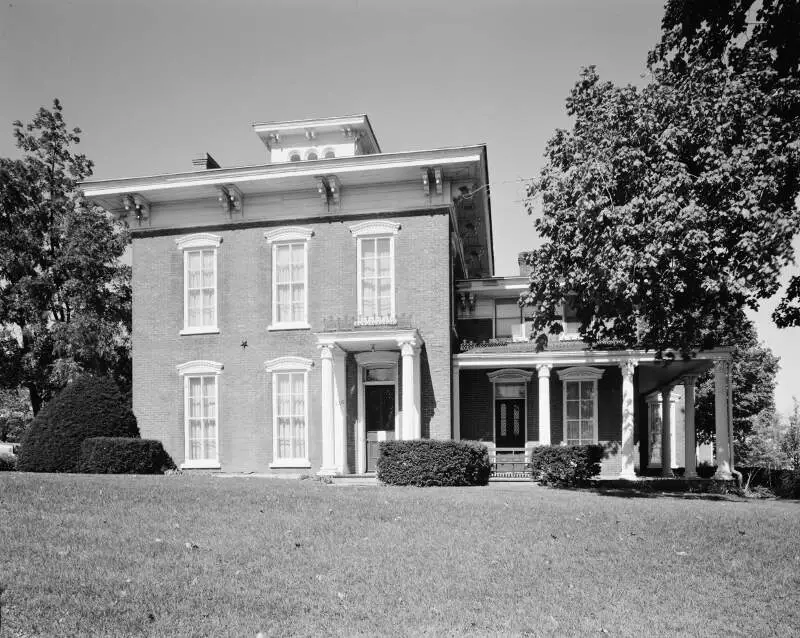
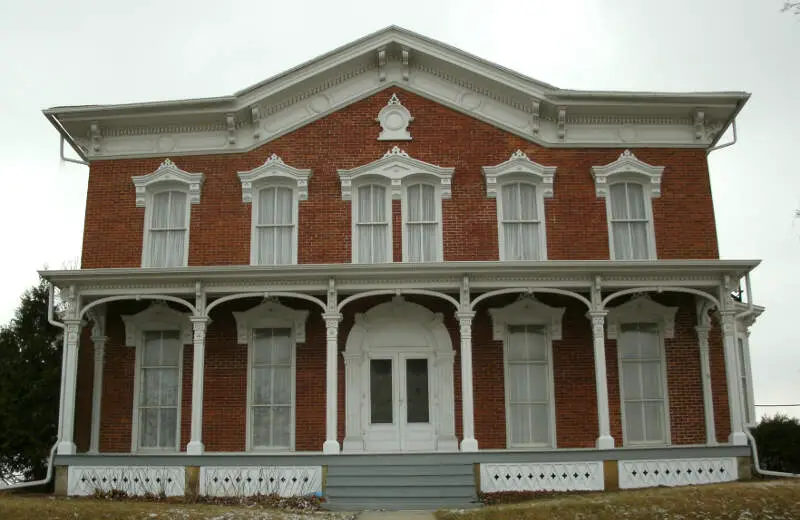
Waterloo, IA Photos


2 Reviews & Comments About Waterloo
/5

Flow - None
I live in a town next to Waterloo where the most you hear about us is the grand opening of some restaurant or something. But when we hear news about waterloo it's always things like someone was shot and killed or stabbed to death or something. And now people are coming to the town I live in and killing people around there. It's all people from Waterloo and the people there are genuinely nice and are just living in the wrong town with the wrong people. Anyways it's sad how they all kill each other in that town and everything is generally perfect in my town even though they are basically connected. What also s***s is people from Waterloo are coming to my town and shooting at innocent people it really just s***s.
HomeSnacks User - 2019-05-12 03:22:54.690236
Commenting on the review left by the Cedar Falls person. Your people- "Your" people must be into drugs,too, or my people wouldn't be bothering yours. My family lives in both communities and we have never been shot at or anything like that.
My favorite place is home.
Rankings for Waterloo in Iowa


Locations Around Waterloo
Map Of Waterloo, IA
Best Places Around Waterloo
Marion, IA
Population 41,690
Waverly, IA
Population 10,446
Hiawatha, IA
Population 7,178
Central, LA
Population 29,603
Cedar Falls, IA
Population 40,662
Independence, IA
Population 6,149
Manchester, IA
Population 5,144
Iowa Falls, IA
Population 5,062
Vinton, IA
Population 4,948
Marshalltown, IA
Population 27,491
Waterloo Demographics And Statistics
Population over time in Waterloo
The current population in Waterloo is 66,947. The population has decreased -1.4% from 2010.
| Year | Population | % Change |
|---|---|---|
| 2023 | 66,947 | -0.5% |
| 2022 | 67,256 | -0.6% |
| 2021 | 67,695 | 0.0% |
| 2020 | 67,671 | -0.4% |
| 2019 | 67,912 | -0.3% |
| 2018 | 68,134 | -0.0% |
| 2017 | 68,146 | -0.3% |
| 2016 | 68,357 | -0.1% |
| 2015 | 68,432 | 0.1% |
| 2014 | 68,392 | 0.1% |
| 2013 | 68,327 | 0.1% |
| 2012 | 68,248 | 0.2% |
| 2011 | 68,106 | 0.3% |
| 2010 | 67,893 | - |
Race / Ethnicity in Waterloo
Waterloo is:
67.1% White with 44,954 White residents.
16.9% African American with 11,343 African American residents.
0.1% American Indian with 95 American Indian residents.
2.6% Asian with 1,758 Asian residents.
1.1% Hawaiian with 706 Hawaiian residents.
0.1% Other with 57 Other residents.
4.4% Two Or More with 2,942 Two Or More residents.
7.6% Hispanic with 5,092 Hispanic residents.
| Race | Waterloo | IA | USA |
|---|---|---|---|
| White | 67.1% | 83.1% | 58.2% |
| African American | 16.9% | 3.8% | 12.0% |
| American Indian | 0.1% | 0.2% | 0.5% |
| Asian | 2.6% | 2.4% | 5.7% |
| Hawaiian | 1.1% | 0.1% | 0.2% |
| Other | 0.1% | 0.2% | 0.5% |
| Two Or More | 4.4% | 3.2% | 3.9% |
| Hispanic | 7.6% | 7.0% | 19.0% |
Gender in Waterloo
Waterloo is 50.7% female with 33,971 female residents.
Waterloo is 49.3% male with 32,976 male residents.
| Gender | Waterloo | IA | USA |
|---|---|---|---|
| Female | 50.7% | 49.9% | 50.5% |
| Male | 49.3% | 50.1% | 49.5% |
Highest level of educational attainment in Waterloo for adults over 25
5.0% of adults in Waterloo completed < 9th grade.
5.0% of adults in Waterloo completed 9-12th grade.
35.0% of adults in Waterloo completed high school / ged.
22.0% of adults in Waterloo completed some college.
10.0% of adults in Waterloo completed associate's degree.
16.0% of adults in Waterloo completed bachelor's degree.
5.0% of adults in Waterloo completed master's degree.
1.0% of adults in Waterloo completed professional degree.
1.0% of adults in Waterloo completed doctorate degree.
| Education | Waterloo | IA | USA |
|---|---|---|---|
| < 9th Grade | 5.0% | 3.0% | 5.0% |
| 9-12th Grade | 5.0% | 4.0% | 6.0% |
| High School / GED | 35.0% | 30.0% | 26.0% |
| Some College | 22.0% | 20.0% | 19.0% |
| Associate's Degree | 10.0% | 12.0% | 9.0% |
| Bachelor's Degree | 16.0% | 21.0% | 21.0% |
| Master's Degree | 5.0% | 7.0% | 10.0% |
| Professional Degree | 1.0% | 2.0% | 2.0% |
| Doctorate Degree | 1.0% | 1.0% | 2.0% |
Household Income For Waterloo, Iowa
5.4% of households in Waterloo earn Less than $10,000.
5.5% of households in Waterloo earn $10,000 to $14,999.
9.2% of households in Waterloo earn $15,000 to $24,999.
8.5% of households in Waterloo earn $25,000 to $34,999.
14.5% of households in Waterloo earn $35,000 to $49,999.
21.6% of households in Waterloo earn $50,000 to $74,999.
13.1% of households in Waterloo earn $75,000 to $99,999.
13.5% of households in Waterloo earn $100,000 to $149,999.
4.8% of households in Waterloo earn $150,000 to $199,999.
4.0% of households in Waterloo earn $200,000 or more.
| Income | Waterloo | IA | USA |
|---|---|---|---|
| Less than $10,000 | 5.4% | 4.0% | 4.9% |
| $10,000 to $14,999 | 5.5% | 3.4% | 3.6% |
| $15,000 to $24,999 | 9.2% | 7.0% | 6.6% |
| $25,000 to $34,999 | 8.5% | 7.3% | 6.8% |
| $35,000 to $49,999 | 14.5% | 11.7% | 10.4% |
| $50,000 to $74,999 | 21.6% | 17.8% | 15.7% |
| $75,000 to $99,999 | 13.1% | 14.1% | 12.7% |
| $100,000 to $149,999 | 13.5% | 18.4% | 17.4% |
| $150,000 to $199,999 | 4.8% | 8.4% | 9.3% |
| $200,000 or more | 4.0% | 8.0% | 12.6% |


