Aurora SnackAbility
Overall SnackAbility
Crime in Aurora summary. We use data from the FBI to determine the crime rates in Aurora. Key points include:
There were 2,682 total crimes in Aurora in the last reporting year.
The overall crime rate per 100,000 people in Aurora is 1,517.9 / 100k people.
The violent crime rate per 100,000 people in Aurora is 266.0 / 100k people.
The property crime rate per 100,000 people in Aurora is 1,251.9 / 100k people.
Overall, crime in Aurora is -28.37% below the national average.
Total Crimes
Below National Average
Crime In Aurora Comparison Table
| Statistic | Count Raw |
Aurora / 100k People |
Illinois / 100k People |
National / 100k People |
|---|---|---|---|---|
| Total Crimes Per 100K | 2,682 | 1,517.9 | 2,004.4 | 2,119.2 |
| Violent Crime | 470 | 266.0 | 289.2 | 359.0 |
| Murder | 1 | 0.6 | 5.8 | 5.0 |
| Robbery | 64 | 36.2 | 90.2 | 61.0 |
| Aggravated Assault | 305 | 172.6 | 146.3 | 256.0 |
| Property Crime | 2,212 | 1,251.9 | 1,715.2 | 1,760.0 |
| Burglary | 448 | 253.6 | 290.5 | 229.0 |
| Larceny | 1,306 | 739.2 | 1,134.4 | 1,272.0 |
| Car Theft | 458 | 259.2 | 290.4 | 259.0 |
Source: FBI Uniform Crime Reporting (2024)
Cost of living in Aurora summary. We use data on the cost of living to determine how expensive it is to live in Aurora. Real estate prices drive most of the variance in cost of living around Illinois. Key points include:
The cost of living in Aurora is 106 with 100 being average.
The cost of living in Aurora is 1.1x higher than the national average.
The median home value in Aurora is $316,957.
The median income in Aurora is $93,633.
Aurora's Overall Cost Of Living
Higher Than The National Average
Cost Of Living In Aurora Comparison Table
| Living Expense | Aurora | Illinois | National Average |
|---|---|---|---|
| Overall | 106 | 98 | 100 |
| Services | 99 | 99 | 100 |
| Groceries | 100 | 99 | 100 |
| Health | 113 | 96 | 100 |
| Housing | 106 | 101 | 100 |
| Transportation | 98 | 99 | 100 |
| Utilities | 101 | 101 | 100 |
Source: Cost of living index, normalized to US average = 100
Aurora, IL Weather
The average high in Aurora is 59.3° and the average low is 39.0°.
There are 70.6 days of precipitation each year.
Expect an average of 36.9 inches of precipitation each year with 28.1 inches of snow.
| Stat | Aurora |
|---|---|
| Average Annual High | 59.3 |
| Average Annual Low | 39.0 |
| Annual Precipitation Days | 70.6 |
| Average Annual Precipitation | 36.9 |
| Average Annual Snowfall | 28.1 |
Average High
Days of Rain
Source: NOAA climate normals (30-year)
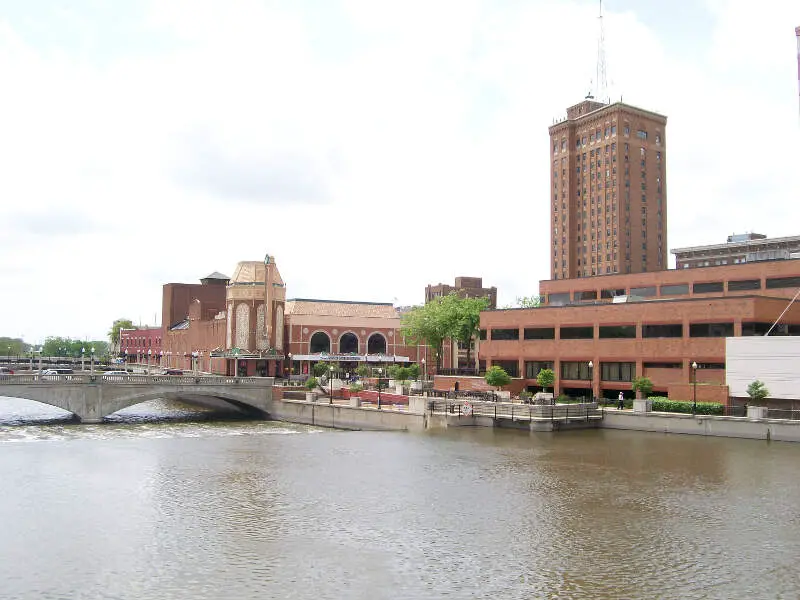
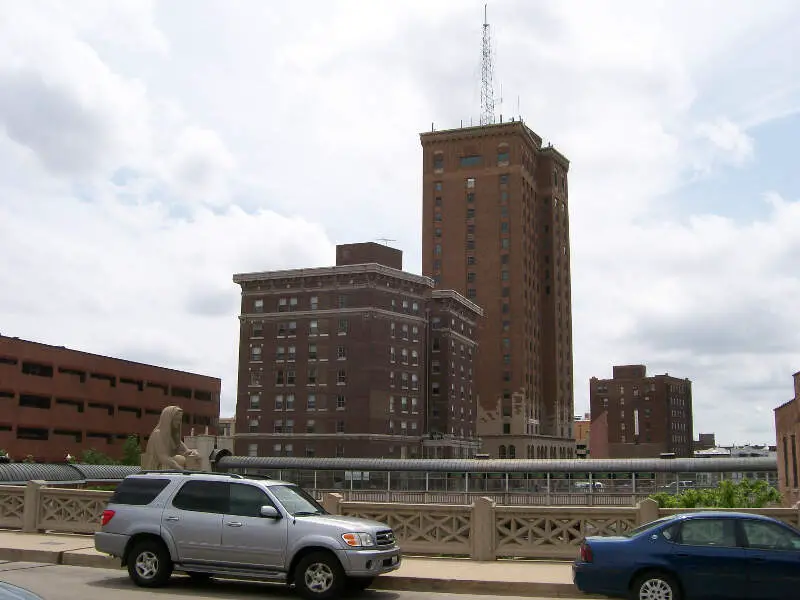
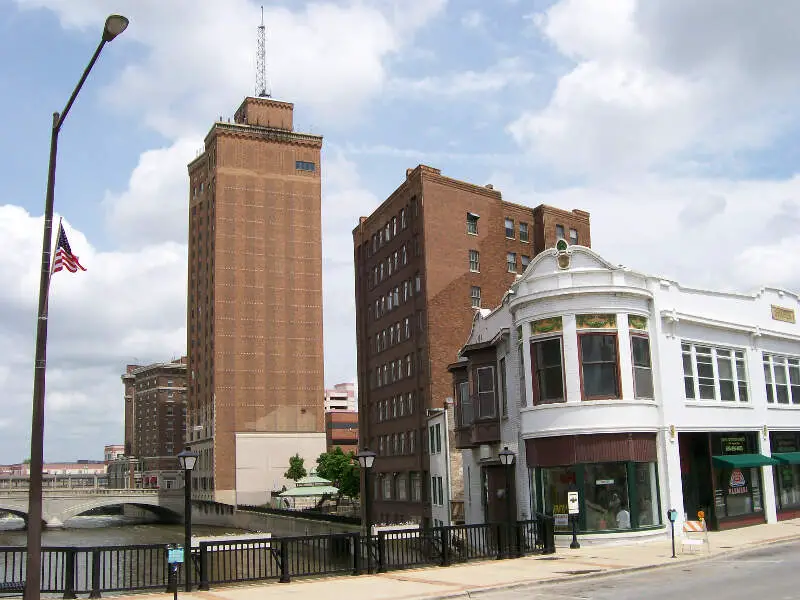
Aurora, IL Photos


Rankings & Articles For Aurora


Locations Around Aurora
Map Of Aurora, IL
Best Places Around Aurora
Hinsdale, IL
Population 17,175
Clarendon Hills, IL
Population 8,659
Winfield, IL
Population 10,095
Glen Ellyn, IL
Population 28,390
Wheaton, IL
Population 53,557
Bartlett, IL
Population 40,501
Burr Ridge, IL
Population 11,141
Naperville, IL
Population 150,692
Darien, IL
Population 21,879
Lisle, IL
Population 23,407
Aurora Demographics And Statistics
Population over time in Aurora
The current population in Aurora is 179,898. The population has decreased 5.5% from 2010.
| Year | Population | % Change |
|---|---|---|
| 2024 | 179,898 | 0.0% |
| 2023 | 179,867 | -0.8% |
| 2022 | 181,405 | -1.1% |
| 2021 | 183,447 | -8.0% |
| 2020 | 199,326 | -0.3% |
| 2019 | 199,927 | -0.4% |
| 2018 | 200,660 | -0.1% |
| 2017 | 200,946 | 0.0% |
| 2016 | 200,907 | 0.1% |
| 2015 | 200,614 | 0.4% |
| 2014 | 199,878 | 0.6% |
| 2013 | 198,726 | 1.1% |
| 2012 | 196,569 | 1.3% |
| 2011 | 194,053 | 1.9% |
| 2010 | 190,437 | - |
Race / Ethnicity in Aurora
See the full breakdown
Aurora is:
32.2% White with 57,856 White residents.
10.7% African American with 19,271 African American residents.
0.0% American Indian with 49 American Indian residents.
12.2% Asian with 21,890 Asian residents.
0.1% Hawaiian with 174 Hawaiian residents.
0.5% Other with 902 Other residents.
2.7% Two Or More with 4,869 Two Or More residents.
41.6% Hispanic with 74,887 Hispanic residents.
| Race | Aurora | IL | USA |
|---|---|---|---|
| White | 32.2% | 58.1% | 57.4% |
| African American | 10.7% | 13.3% | 11.9% |
| American Indian | 0.0% | 0.1% | 0.5% |
| Asian | 12.2% | 5.9% | 5.9% |
| Hawaiian | 0.1% | 0.0% | 0.2% |
| Other | 0.5% | 0.4% | 0.6% |
| Two Or More | 2.7% | 3.4% | 4.3% |
| Hispanic | 41.6% | 18.8% | 19.3% |
Gender in Aurora
See the full breakdown
Aurora is 50.2% female with 90,322 female residents.
Aurora is 49.8% male with 89,575 male residents.
| Gender | Aurora | IL | USA |
|---|---|---|---|
| Female | 50.2% | 50.6% | 50.5% |
| Male | 49.8% | 49.4% | 49.5% |
Highest level of educational attainment in Aurora for adults over 25
See the full breakdown
10.0% of adults in Aurora completed < 9th grade.
7.0% of adults in Aurora completed 9-12th grade.
21.0% of adults in Aurora completed high school / ged.
18.0% of adults in Aurora completed some college.
6.0% of adults in Aurora completed associate's degree.
24.0% of adults in Aurora completed bachelor's degree.
12.0% of adults in Aurora completed master's degree.
1.0% of adults in Aurora completed professional degree.
1.0% of adults in Aurora completed doctorate degree.
| Education | Aurora | IL | USA |
|---|---|---|---|
| < 9th Grade | 10.0% | 5.0% | 4.0% |
| 9-12th Grade | 7.0% | 5.0% | 6.0% |
| High School / GED | 21.0% | 25.0% | 26.0% |
| Some College | 18.0% | 19.0% | 19.0% |
| Associate's Degree | 6.0% | 8.0% | 9.0% |
| Bachelor's Degree | 24.0% | 23.0% | 22.0% |
| Master's Degree | 12.0% | 11.0% | 10.0% |
| Professional Degree | 1.0% | 2.0% | 2.0% |
| Doctorate Degree | 1.0% | 2.0% | 2.0% |
Household Income For Aurora, Illinois
See the full breakdown
4.0% of households in Aurora earn Less than $10,000.
2.1% of households in Aurora earn $10,000 to $14,999.
4.4% of households in Aurora earn $15,000 to $24,999.
3.7% of households in Aurora earn $25,000 to $34,999.
9.0% of households in Aurora earn $35,000 to $49,999.
15.6% of households in Aurora earn $50,000 to $74,999.
14.3% of households in Aurora earn $75,000 to $99,999.
20.0% of households in Aurora earn $100,000 to $149,999.
12.1% of households in Aurora earn $150,000 to $199,999.
14.8% of households in Aurora earn $200,000 or more.
| Income | Aurora | IL | USA |
|---|---|---|---|
| Less than $10,000 | 4.0% | 5.4% | 5.0% |
| $10,000 to $14,999 | 2.1% | 3.2% | 3.4% |
| $15,000 to $24,999 | 4.4% | 5.9% | 6.3% |
| $25,000 to $34,999 | 3.7% | 6.3% | 6.6% |
| $35,000 to $49,999 | 9.0% | 9.7% | 10.1% |
| $50,000 to $74,999 | 15.6% | 14.8% | 15.5% |
| $75,000 to $99,999 | 14.3% | 12.6% | 12.6% |
| $100,000 to $149,999 | 20.0% | 18.0% | 17.5% |
| $150,000 to $199,999 | 12.1% | 10.1% | 9.6% |
| $200,000 or more | 14.8% | 13.8% | 13.4% |
Source: U.S. Census ACS 5-year estimates (2024)


