100 Biggest Cities In Illinois For 2026
Using the latest Census data, we detail the 100 biggest cities in Illinois. You can all see a comprehensive list of all 690 cities and places in Illinois.

We all love the biggest cities that the Prairie State has to offer. You know the places like Chicago and Aurora which make all the headlines.
But there are a bunch of other great large cities in Illinois that don't get as much love.
We're going to change that right now.
Using the most recent Census data, we can tell you about all the places in Illinois with a focus on the biggest. We update the data each year and this is our fourth time doing this.
Table Of Contents: Top Ten | Methodology | Table
The Largest Cities In Illinois For 2026:
You can click here to see a full table of the full of the 100 biggest cities in Illinois, along with every other place over 1,000 people big. It is sortable by clicking on the headers.
Read on below to see more on the biggest cities. Or for more reading on places to live in Illinois, check out:
- Best Places To Live In Illinois
- Cheapest Places To Live In Illinois
- Most Dangerous Cities In Illinois
The 10 Biggest Cities In Illinois

/10
Rank Last Year: 1 (No Change)
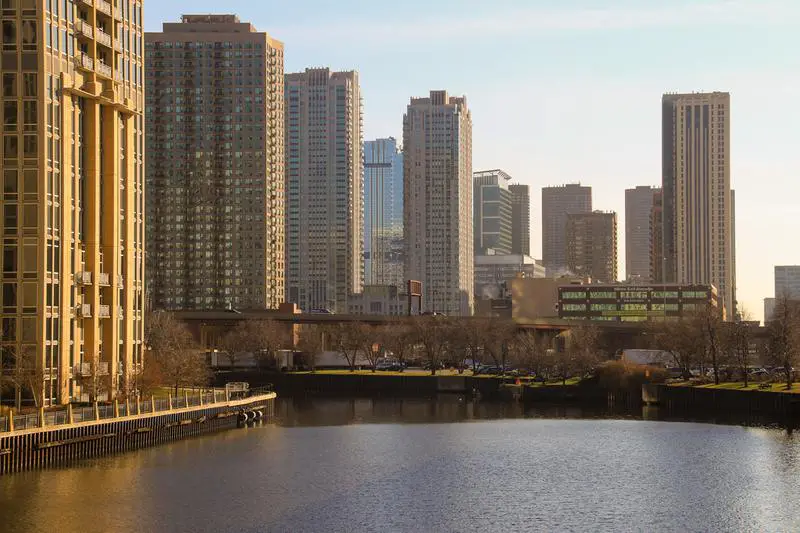
Population: 2,711,226.0
Population 2010: 2,703,466
Growth: 0.3%
More on Chicago: Data | Crime | Cost Of Living | Real Estate

/10
Rank Last Year: 2 (No Change)
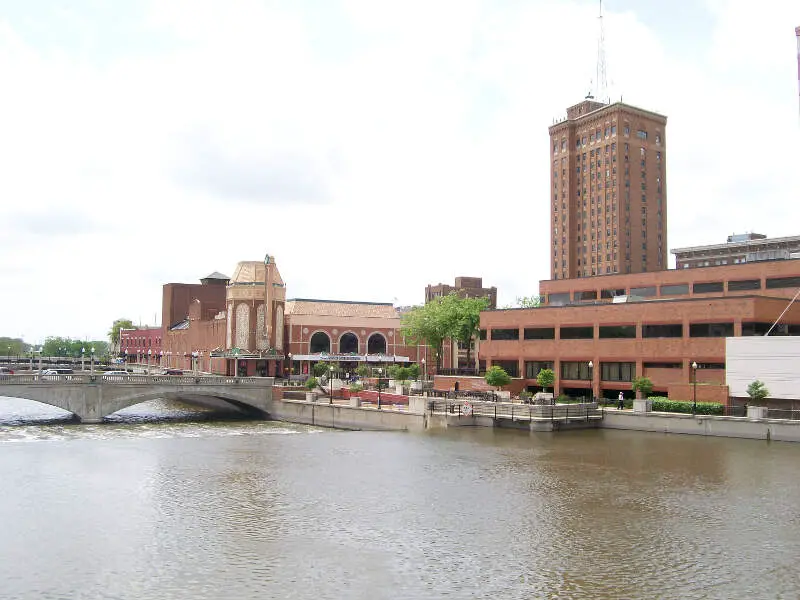
Population: 179,898.0
Population 2010: 190,437
Growth: -5.5%
More on Aurora: Data | Crime | Cost Of Living | Real Estate

/10
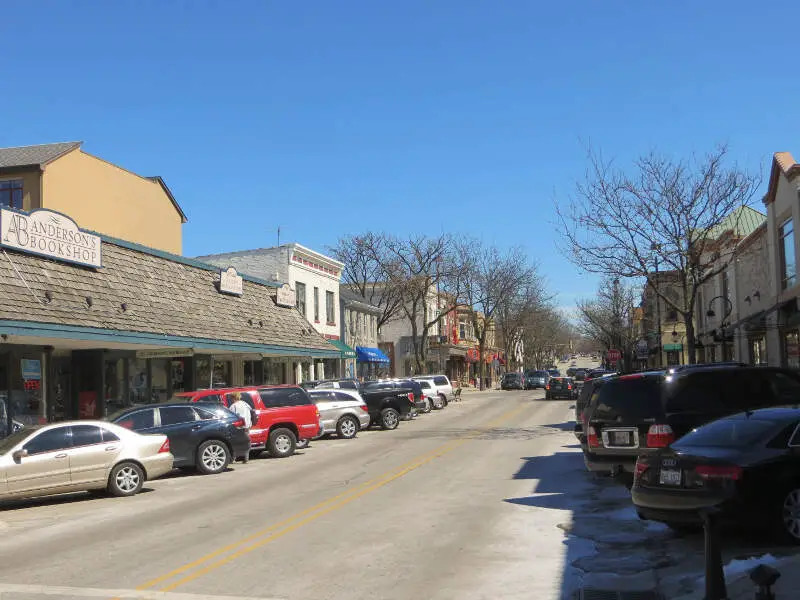
Rank Last Year: 4 (Up 1)
Population: 150,692.0
Population 2010: 140,838
Growth: 7.0%
More on Naperville: Data | Crime | Cost Of Living | Real Estate

/10
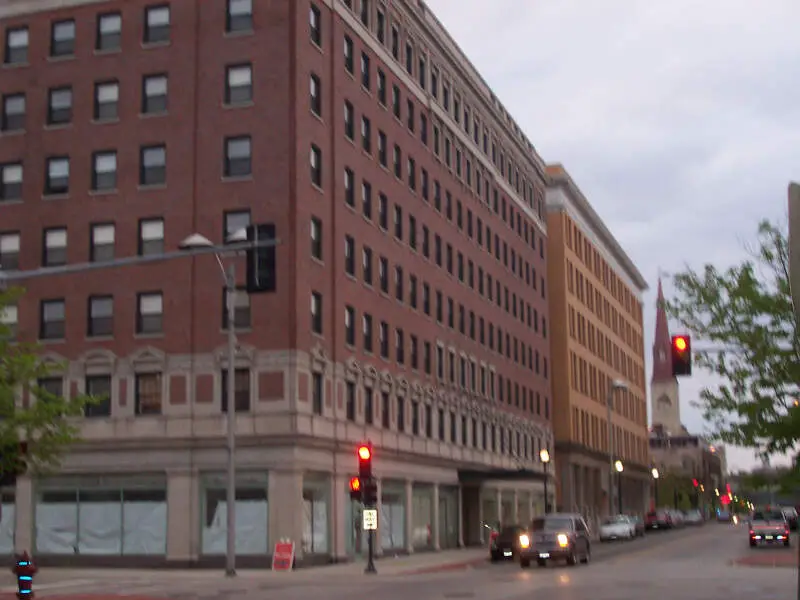
Rank Last Year: 3 (Down 1)
Population: 150,445.0
Population 2010: 145,002
Growth: 3.8%
More on Joliet: Data | Crime | Cost Of Living | Real Estate

/10
Rank Last Year: 5 (No Change)
Population: 147,521.0
Population 2010: 154,517
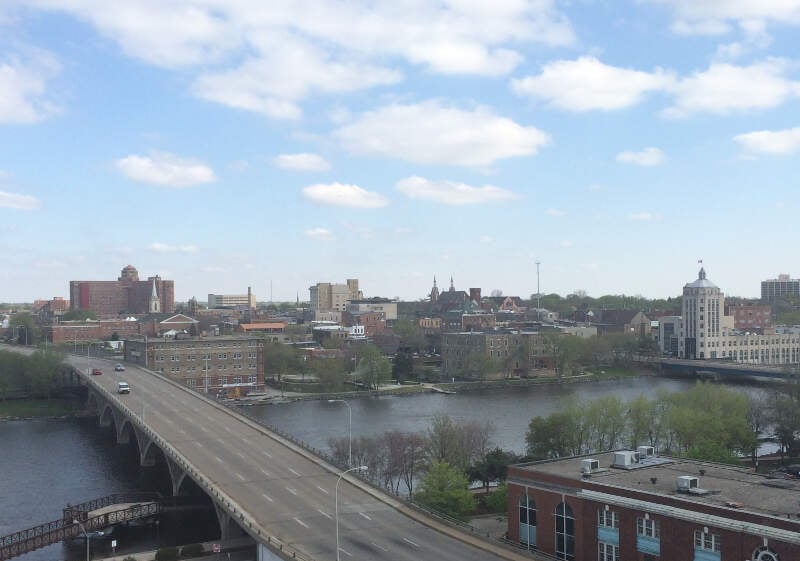
Growth: -4.5%
More on Rockford: Data | Crime | Cost Of Living | Real Estate

/10
Rank Last Year: 6 (No Change)
Population: 114,934.0
Population 2010: 106,837
Growth: 7.6%
More on Elgin: Data | Crime | Cost Of Living | Real Estate

/10
Rank Last Year: 7 (No Change)
Population: 113,330.0
Population 2010: 115,121
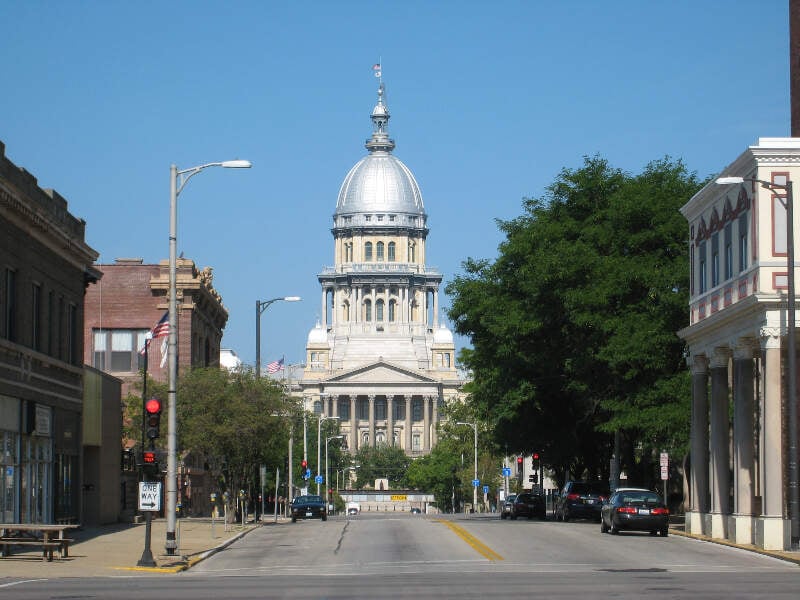
Growth: -1.6%
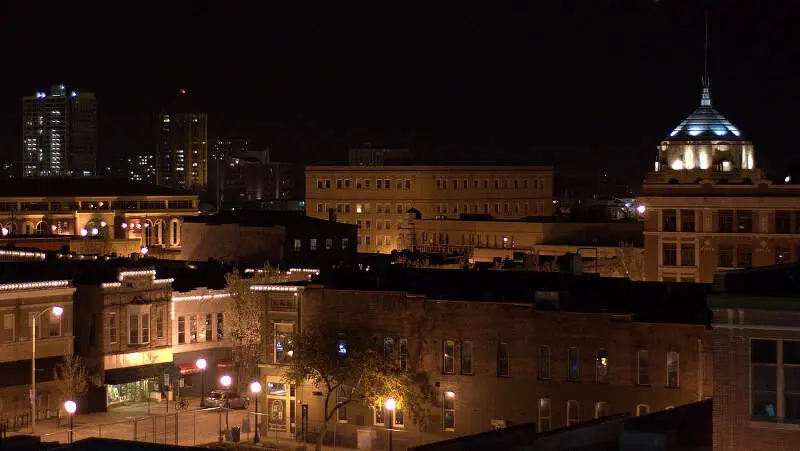
More on Springfield: Data | Crime | Cost Of Living | Real Estate

/10
Rank Last Year: 8 (No Change)
Population: 112,169.0
Population 2010: 113,853
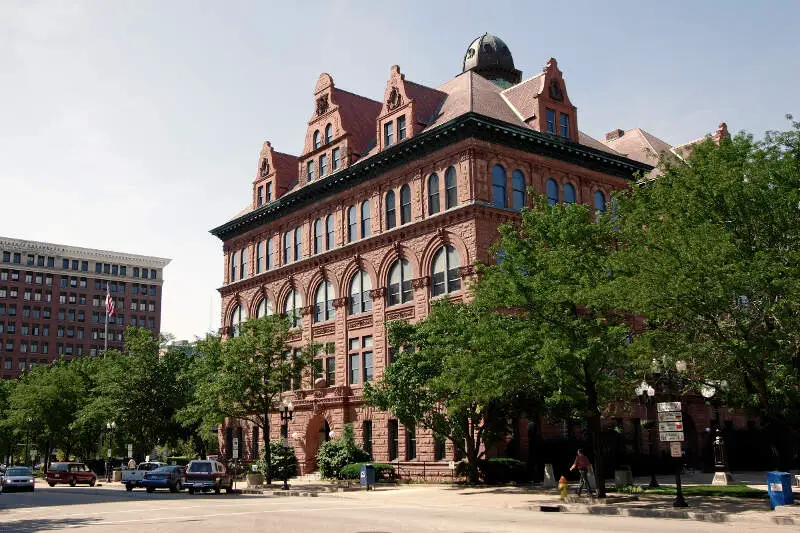
Growth: -1.5%
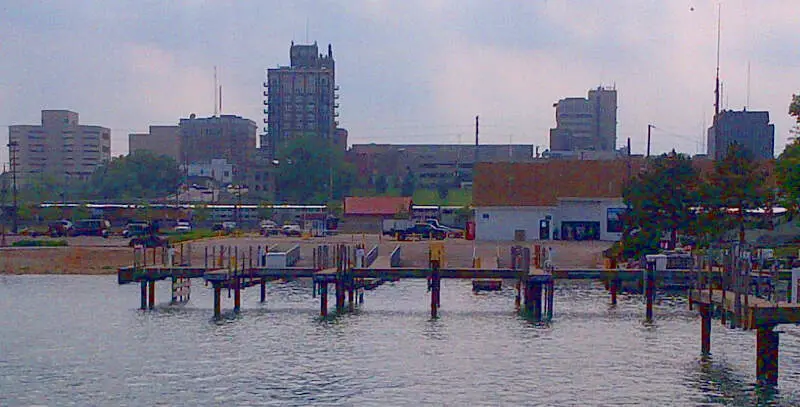
More on Peoria: Data | Crime | Cost Of Living | Real Estate

/10
Rank Last Year: 10 (Up 1)
Population: 89,996.0
Population 2010: 79,430
Growth: 13.3%
More on Champaign: Data | Crime | Cost Of Living | Real Estate

/10
Rank Last Year: 9 (Down 1)
Population: 89,076.0
Population 2010: 89,382
Growth: -0.3%
More on Waukegan: Data | Crime | Cost Of Living | Real Estate
How We Determined The Largest Cities In Illinois
We've been ranking and dissecting cities in the Prairie State for over 4 years now -- making this actually the fourth time we've run the numbers. We always use the best data, the US Census. In this case, that means we are using the American Community Survey.
It what is probably the most simple analysis we run each year, we ranked every place in Illinois from biggest to smallest. The biggest city this year? That would be Chicago.
The smallest? Cuba, although there are places smaller than 1,000 people not listed here, so keep that in mind as we take a look at the top ten.
Now on to numbers 11-100 Biggest in Illinois
We hope that you find the big city, or really any city, that's right for you. Below is a list of the rest of the biggest cities along with every other place in Illinois.
Have fun snacking around in the Prairie State!
For more reading on Illinois, check out:
- Best Places To Raise A Family In Illinois
- Best Places To Retire In Illinois
- Richest Cities In Illinois
- Safest Places In Illinois
- Worst Places To Live In Illinois
- Most Expensive Places To Live In Illinois
Detailed List Of The Biggest Cities In Illinois
| Rank | City | Current Population | 2010 | Growth | |||||
|---|---|---|---|---|---|---|---|---|---|
| 1 | Chicago | 2,711,226.0 | 2,703,466 | 0.3% | |||||
| 2 | Aurora | 179,898.0 | 190,437 | -5.5% | |||||
| 3 | Naperville | 150,692.0 | 140,838 | 7.0% | |||||
| 4 | Joliet | 150,445.0 | 145,002 | 3.8% | |||||
| 5 | Rockford | 147,521.0 | 154,517 | -4.5% | |||||
| 6 | Elgin | 114,934.0 | 106,837 | 7.6% | |||||
| 7 | Springfield | 113,330.0 | 115,121 | -1.6% | |||||
| 8 | Peoria | 112,169.0 | 113,853 | -1.5% | |||||
| 9 | Champaign | 89,996.0 | 79,430 | 13.3% | |||||
| 10 | Waukegan | 89,076.0 | 89,382 | -0.3% | |||||
| 11 | Cicero | 82,797.0 | 83,332 | -0.6% | |||||
| 12 | Bloomington | 78,907.0 | 74,864 | 5.4% | |||||
| 13 | Schaumburg | 76,868.0 | 73,333 | 4.8% | |||||
| 14 | Evanston | 76,340.0 | 73,880 | 3.3% | |||||
| 15 | Arlington Heights | 76,005.0 | 74,967 | 1.4% | |||||
| 16 | Bolingbrook | 74,096.0 | 72,649 | 2.0% | |||||
| 17 | Decatur | 69,815.0 | 76,429 | -8.7% | |||||
| 18 | Palatine | 66,293.0 | 67,414 | -1.7% | |||||
| 19 | Skokie | 66,219.0 | 63,824 | 3.8% | |||||
| 20 | Des Plaines | 59,156.0 | 57,357 | 3.1% | |||||
| 21 | Orland Park | 57,916.0 | 55,098 | 5.1% | |||||
| 22 | Oak Lawn | 56,861.0 | 55,830 | 1.8% | |||||
| 23 | Berwyn | 55,595.0 | 55,584 | 0.0% | |||||
| 24 | Mount Prospect | 55,472.0 | 53,838 | 3.0% | |||||
| 25 | Tinley Park | 54,842.0 | 54,943 | -0.2% | |||||
| 26 | Normal | 53,569.0 | 51,610 | 3.8% | |||||
| 27 | Wheaton | 53,557.0 | 53,141 | 0.8% | |||||
| 28 | Oak Park | 53,292.0 | 51,426 | 3.6% | |||||
| 29 | Hoffman Estates | 51,175.0 | 51,203 | -0.1% | |||||
| 30 | Downers Grove | 50,054.0 | 47,938 | 4.4% | |||||
| 31 | Glenview | 47,752.0 | 43,649 | 9.4% | |||||
| 32 | Plainfield | 46,708.0 | 35,708 | 30.8% | |||||
| 33 | Elmhurst | 45,671.0 | 43,753 | 4.4% | |||||
| 34 | Lombard | 43,619.0 | 42,722 | 2.1% | |||||
| 35 | Buffalo Grove | 42,891.0 | 41,859 | 2.5% | |||||
| 36 | Moline | 42,197.0 | 43,331 | -2.6% | |||||
| 37 | Belleville | 41,370.0 | 43,942 | -5.9% | |||||
| 38 | Romeoville | 41,152.0 | 37,484 | 9.8% | |||||
| 39 | Crystal Lake | 40,579.0 | 41,044 | -1.1% | |||||
| 40 | Bartlett | 40,501.0 | 40,122 | 0.9% | |||||
| 41 | Dekalb | 40,443.0 | 43,995 | -8.1% | |||||
| 42 | Carol Stream | 39,460.0 | 39,740 | -0.7% | |||||
| 43 | Urbana | 39,341.0 | 40,801 | -3.6% | |||||
| 44 | Quincy | 39,109.0 | 40,496 | -3.4% | |||||
| 45 | Streamwood | 39,001.0 | 39,267 | -0.7% | |||||
| 46 | Park Ridge | 38,667.0 | 37,115 | 4.2% | |||||
| 47 | Wheeling | 38,433.0 | 37,030 | 3.8% | |||||
| 48 | Carpentersville | 37,346.0 | 37,094 | 0.7% | |||||
| 49 | Hanover Park | 36,732.0 | 37,743 | -2.7% | |||||
| 50 | Oswego | 36,375.0 | 27,719 | 31.2% | |||||
| 51 | Rock Island | 36,151.0 | 38,817 | -6.9% | |||||
| 52 | Addison | 35,489.0 | 36,670 | -3.2% | |||||
| 53 | Calumet City | 35,100.0 | 36,975 | -5.1% | |||||
| 54 | Northbrook | 34,585.0 | 32,922 | 5.1% | |||||
| 55 | Woodridge | 33,941.0 | 32,475 | 4.5% | |||||
| 56 | St. Charles | 32,854.0 | 32,392 | 1.4% | |||||
| 57 | Glendale Heights | 32,808.0 | 33,664 | -2.5% | |||||
| 58 | O'fallon | 32,262.0 | 27,044 | 19.3% | |||||
| 59 | Elk Grove Village | 31,987.0 | 33,072 | -3.3% | |||||
| 60 | Mundelein | 31,915.0 | 31,146 | 2.5% | |||||
| 61 | Pekin | 31,781.0 | 33,733 | -5.8% | |||||
| 62 | North Chicago | 30,643.0 | 33,010 | -7.2% | |||||
| 63 | Gurnee | 30,510.0 | 31,068 | -1.8% | |||||
| 64 | Highland Park | 30,398.0 | 30,080 | 1.1% | |||||
| 65 | Algonquin | 30,067.0 | 29,407 | 2.2% | |||||
| 66 | Niles | 30,064.0 | 29,463 | 2.0% | |||||
| 67 | Galesburg | 29,481.0 | 32,176 | -8.4% | |||||
| 68 | Lake In The Hills | 28,800.0 | 28,596 | 0.7% | |||||
| 69 | Burbank | 28,739.0 | 28,427 | 1.1% | |||||
| 70 | Danville | 28,595.0 | 33,239 | -14.0% | |||||
| 71 | Glen Ellyn | 28,390.0 | 27,397 | 3.6% | |||||
| 72 | Lansing | 28,284.0 | 28,005 | 1.0% | |||||
| 73 | Mchenry | 28,074.0 | 26,518 | 5.9% | |||||
| 74 | New Lenox | 28,006.0 | 23,946 | 17.0% | |||||
| 75 | Huntley | 28,005.0 | 21,261 | 31.7% | |||||
| 76 | Wilmette | 27,503.0 | 26,928 | 2.1% | |||||
| 77 | Batavia | 27,151.0 | 25,924 | 4.7% | |||||
| 78 | Round Lake Beach | 27,079.0 | 28,006 | -3.3% | |||||
| 79 | Vernon Hills | 26,876.0 | 24,388 | 10.2% | |||||
| 80 | Oak Forest | 26,805.0 | 27,685 | -3.2% | |||||
| 81 | Chicago Heights | 26,736.0 | 30,414 | -12.1% | |||||
| 82 | Granite City | 26,549.0 | 30,481 | -12.9% | |||||
| 83 | Edwardsville | 26,474.0 | 23,450 | 12.9% | |||||
| 84 | Lockport | 26,409.0 | 23,844 | 10.8% | |||||
| 85 | Woodstock | 26,147.0 | 24,414 | 7.1% | |||||
| 86 | West Chicago | 25,395.0 | 26,348 | -3.6% | |||||
| 87 | Alton | 25,279.0 | 28,380 | -10.9% | |||||
| 88 | Belvidere | 24,752.0 | 25,303 | -2.2% | |||||
| 89 | Morton Grove | 24,619.0 | 22,868 | 7.7% | |||||
| 90 | Zion | 24,600.0 | 24,375 | 0.9% | |||||
| 91 | Melrose Park | 24,549.0 | 24,725 | -0.7% | |||||
| 92 | Homer Glen | 24,529.0 | 24,723 | -0.8% | |||||
| 93 | South Elgin | 24,217.0 | 21,235 | 14.0% | |||||
| 94 | Collinsville | 24,031.0 | 25,419 | -5.5% | |||||
| 95 | Rolling Meadows | 24,027.0 | 23,601 | 1.8% | |||||
| 96 | Kankakee | 23,996.0 | 27,598 | -13.1% | |||||
| 97 | Elmwood Park | 23,868.0 | 24,710 | -3.4% | |||||
| 98 | Westmont | 23,724.0 | 24,494 | -3.1% | |||||
| 99 | Yorkville | 23,617.0 | 15,065 | 56.8% | |||||
| 100 | Freeport | 23,505.0 | 25,686 | -8.5% | |||||
| 101 | Loves Park | 23,502.0 | 23,723 | -0.9% | |||||
| 102 | Lisle | 23,407.0 | 22,288 | 5.0% | |||||
| 103 | Maywood | 23,201.0 | 24,338 | -4.7% | |||||
| 104 | Roselle | 22,752.0 | 22,733 | 0.1% | |||||
| 105 | Machesney Park | 22,630.0 | 23,070 | -1.9% | |||||
| 106 | Bloomingdale | 22,457.0 | 21,877 | 2.7% | |||||
| 107 | Villa Park | 22,345.0 | 22,249 | 0.4% | |||||
| 108 | East Peoria | 22,324.0 | 23,221 | -3.9% | |||||
| 109 | Carbondale | 22,158.0 | 25,732 | -13.9% | |||||
| 110 | Darien | 21,879.0 | 22,163 | -1.3% | |||||
| 111 | Blue Island | 21,741.0 | 22,990 | -5.4% | |||||
| 112 | Montgomery | 21,515.0 | 15,957 | 34.8% | |||||
| 113 | Geneva | 21,258.0 | 21,448 | -0.9% | |||||
| 114 | Park Forest | 21,156.0 | 22,330 | -5.3% | |||||
| 115 | Grayslake | 20,929.0 | 20,671 | 1.2% | |||||
| 116 | South Holland | 20,911.0 | 21,880 | -4.4% | |||||
| 117 | East Moline | 20,904.0 | 21,370 | -2.2% | |||||
| 118 | Dolton | 20,825.0 | 23,324 | -10.7% | |||||
| 119 | Frankfort | 20,651.0 | 17,056 | 21.1% | |||||
| 120 | Crest Hill | 20,628.0 | 20,313 | 1.6% | |||||
| 121 | Libertyville | 20,525.0 | 20,530 | -0.0% | |||||
| 122 | Harvey | 20,230.0 | 25,489 | -20.6% | |||||
| 123 | Mokena | 20,021.0 | 18,164 | 10.2% | |||||
| 124 | Lake Zurich | 19,832.0 | 19,554 | 1.4% | |||||
| 125 | Deerfield | 19,518.0 | 18,405 | 6.0% | |||||
| 126 | Evergreen Park | 19,420.0 | 19,815 | -2.0% | |||||
| 127 | Lake Forest | 19,416.0 | 19,397 | 0.1% | |||||
| 128 | Brookfield | 19,331.0 | 18,807 | 2.8% | |||||
| 129 | Homewood | 19,294.0 | 19,328 | -0.2% | |||||
| 130 | North Aurora | 18,696.0 | 15,680 | 19.2% | |||||
| 131 | Matteson | 18,645.0 | 17,756 | 5.0% | |||||
| 132 | Round Lake | 18,628.0 | 16,163 | 15.3% | |||||
| 133 | Bensenville | 18,603.0 | 18,661 | -0.3% | |||||
| 134 | Alsip | 18,583.0 | 19,134 | -2.9% | |||||
| 135 | Sycamore | 18,559.0 | 16,800 | 10.5% | |||||
| 136 | Ottawa | 18,447.0 | 19,263 | -4.2% | |||||
| 137 | Shorewood | 18,343.0 | 14,718 | 24.6% | |||||
| 138 | Bellwood | 18,256.0 | 19,114 | -4.5% | |||||
| 139 | Franklin Park | 18,197.0 | 18,346 | -0.8% | |||||
| 140 | Palos Hills | 18,081.0 | 17,366 | 4.1% | |||||
| 141 | Bourbonnais | 18,078.0 | 18,101 | -0.1% | |||||
| 142 | Jacksonville | 18,014.0 | 19,408 | -7.2% | |||||
| 143 | East St. Louis | 17,999.0 | 27,750 | -35.1% | |||||
| 144 | Cary | 17,923.0 | 18,167 | -1.3% | |||||
| 145 | Lemont | 17,820.0 | 15,320 | 16.3% | |||||
| 146 | Godfrey | 17,712.0 | 17,819 | -0.6% | |||||
| 147 | Hinsdale | 17,175.0 | 16,633 | 3.3% | |||||
| 148 | Charleston | 17,062.0 | 21,746 | -21.5% | |||||
| 149 | Bridgeview | 16,849.0 | 16,144 | 4.4% | |||||
| 150 | Marion | 16,836.0 | 17,003 | -1.0% | |||||
| 151 | Fairview Heights | 16,745.0 | 16,504 | 1.5% | |||||
| 152 | Morton | 16,595.0 | 15,986 | 3.8% | |||||
| 153 | Mattoon | 16,586.0 | 17,720 | -6.4% | |||||
| 154 | Westchester | 16,436.0 | 16,542 | -0.6% | |||||
| 155 | Country Club Hills | 16,324.0 | 16,286 | 0.2% | |||||
| 156 | La Grange | 15,998.0 | 15,430 | 3.7% | |||||
| 157 | Washington | 15,919.0 | 14,456 | 10.1% | |||||
| 158 | Prospect Heights | 15,618.0 | 16,252 | -3.9% | |||||
| 159 | Norridge | 15,439.0 | 14,414 | 7.1% | |||||
| 160 | Bradley | 15,325.0 | 15,394 | -0.4% | |||||
| 161 | Dixon | 14,910.0 | 15,440 | -3.4% | |||||
| 162 | Morris | 14,898.0 | 13,533 | 10.1% | |||||
| 163 | Macomb | 14,894.0 | 19,282 | -22.8% | |||||
| 164 | Antioch | 14,859.0 | 13,519 | 9.9% | |||||
| 165 | Warrenville | 14,718.0 | 13,214 | 11.4% | |||||
| 166 | Sterling | 14,717.0 | 15,450 | -4.7% | |||||
| 167 | Swansea | 14,710.0 | 12,941 | 13.7% | |||||
| 168 | Chatham | 14,639.0 | 11,120 | 31.6% | |||||
| 169 | Shiloh | 14,572.0 | 12,015 | 21.3% | |||||
| 170 | Hickory Hills | 14,526.0 | 14,004 | 3.7% | |||||
| 171 | Lindenhurst | 14,417.0 | 14,227 | 1.3% | |||||
| 172 | Beach Park | 14,115.0 | 13,315 | 6.0% | |||||
| 173 | Chicago Ridge | 14,099.0 | 14,145 | -0.3% | |||||
| 174 | Mount Vernon | 14,090.0 | 15,003 | -6.1% | |||||
| 175 | Wauconda | 14,027.0 | 13,009 | 7.8% | |||||
| 176 | Glen Carbon | 13,977.0 | 12,304 | 13.6% | |||||
| 177 | Midlothian | 13,948.0 | 14,581 | -4.3% | |||||
| 178 | Forest Park | 13,943.0 | 14,282 | -2.4% | |||||
| 179 | Wood Dale | 13,933.0 | 13,678 | 1.9% | |||||
| 180 | Channahon | 13,927.0 | 12,215 | 14.0% | |||||
| 181 | Hazel Crest | 13,792.0 | 14,271 | -3.4% | |||||
| 182 | La Grange Park | 13,447.0 | 13,387 | 0.4% | |||||
| 183 | Western Springs | 13,446.0 | 12,657 | 6.2% | |||||
| 184 | Lincoln | 13,281.0 | 14,441 | -8.0% | |||||
| 185 | Canton | 13,144.0 | 14,764 | -11.0% | |||||
| 186 | Lincolnwood | 13,112.0 | 12,422 | 5.6% | |||||
| 187 | Minooka | 12,891.0 | 9,522 | 35.4% | |||||
| 188 | Richton Park | 12,521.0 | 13,327 | -6.0% | |||||
| 189 | Northlake | 12,513.0 | 12,156 | 2.9% | |||||
| 190 | Winnetka | 12,484.0 | 12,112 | 3.1% | |||||
| 191 | Rantoul | 12,421.0 | 12,551 | -1.0% | |||||
| 192 | Effingham | 12,342.0 | 12,076 | 2.2% | |||||
| 193 | Streator | 12,330.0 | 13,195 | -6.6% | |||||
| 194 | Justice | 12,324.0 | 12,633 | -2.4% | |||||
| 195 | Herrin | 12,226.0 | 12,312 | -0.7% | |||||
| 196 | Plano | 12,203.0 | 9,472 | 28.8% | |||||
| 197 | Palos Heights | 12,152.0 | 12,185 | -0.3% | |||||
| 198 | River Forest | 11,992.0 | 11,166 | 7.4% | |||||
| 199 | Kewanee | 11,913.0 | 13,014 | -8.5% | |||||
| 200 | Centralia | 11,856.0 | 13,250 | -10.5% | |||||
| 201 | Troy | 11,647.0 | 9,745 | 19.5% | |||||
| 202 | Schiller Park | 11,393.0 | 11,668 | -2.4% | |||||
| 203 | Markham | 11,355.0 | 12,408 | -8.5% | |||||
| 204 | Pontiac | 11,294.0 | 12,215 | -7.5% | |||||
| 205 | Burr Ridge | 11,141.0 | 10,505 | 6.1% | |||||
| 206 | Fox Lake | 11,131.0 | 10,515 | 5.9% | |||||
| 207 | Waterloo | 11,129.0 | 9,640 | 15.4% | |||||
| 208 | Columbia | 11,127.0 | 9,469 | 17.5% | |||||
| 209 | Barrington | 11,077.0 | 10,662 | 3.9% | |||||
| 210 | Manhattan | 11,026.0 | 6,511 | 69.3% | |||||
| 211 | Pingree Grove | 10,914.0 | 3,780 | 188.7% | |||||
| 212 | Campton Hills | 10,877.0 | 10,780 | 0.9% | |||||
| 213 | Summit | 10,846.0 | 10,865 | -0.2% | |||||
| 214 | Gages Lake | 10,819.0 | 10,166 | 6.4% | |||||
| 215 | Roscoe | 10,706.0 | 10,164 | 5.3% | |||||
| 216 | Worth | 10,700.0 | 10,677 | 0.2% | |||||
| 217 | Taylorville | 10,646.0 | 12,668 | -16.0% | |||||
| 218 | Crestwood | 10,579.0 | 10,922 | -3.1% | |||||
| 219 | River Grove | 10,451.0 | 10,200 | 2.5% | |||||
| 220 | Riverdale | 10,340.0 | 13,629 | -24.1% | |||||
| 221 | Lyons | 10,339.0 | 10,530 | -1.8% | |||||
| 222 | Wood River | 10,279.0 | 10,817 | -5.0% | |||||
| 223 | Highland | 10,262.0 | 9,416 | 9.0% | |||||
| 224 | Winfield | 10,095.0 | 9,041 | 11.7% | |||||
| 225 | Mahomet | 10,049.0 | 6,888 | 45.9% | |||||
| 226 | Peru | 9,775.0 | 10,239 | -4.5% | |||||
| 227 | Sauk Village | 9,678.0 | 10,360 | -6.6% | |||||
| 228 | Harvard | 9,598.0 | 8,621 | 11.3% | |||||
| 229 | Frankfort Square | 9,560.0 | 9,525 | 0.4% | |||||
| 230 | Rochelle | 9,529.0 | 9,597 | -0.7% | |||||
| 231 | Lasalle | 9,498.0 | 9,697 | -2.1% | |||||
| 232 | Steger | 9,418.0 | 9,734 | -3.2% | |||||
| 233 | Flossmoor | 9,391.0 | 9,218 | 1.9% | |||||
| 234 | Itasca | 9,355.0 | 8,390 | 11.5% | |||||
| 235 | Sugar Grove | 9,240.0 | 8,202 | 12.7% | |||||
| 236 | Bethalto | 9,239.0 | 9,531 | -3.1% | |||||
| 237 | Hawthorn Woods | 9,143.0 | 7,405 | 23.5% | |||||
| 238 | Willowbrook | 9,131.0 | 8,546 | 6.8% | |||||
| 239 | Lynwood | 9,083.0 | 8,725 | 4.1% | |||||
| 240 | Riverside | 9,039.0 | 8,737 | 3.5% | |||||
| 241 | Manteno | 9,030.0 | 8,551 | 5.6% | |||||
| 242 | Boulder Hill | 8,989.0 | 8,641 | 4.0% | |||||
| 243 | Savoy | 8,968.0 | 6,388 | 40.4% | |||||
| 244 | Harwood Heights | 8,821.0 | 8,462 | 4.2% | |||||
| 245 | Mascoutah | 8,816.0 | 7,191 | 22.6% | |||||
| 246 | Glencoe | 8,701.0 | 8,628 | 0.8% | |||||
| 247 | Lake Villa | 8,683.0 | 8,460 | 2.6% | |||||
| 248 | Clarendon Hills | 8,659.0 | 8,275 | 4.6% | |||||
| 249 | Gilberts | 8,606.0 | 5,866 | 46.7% | |||||
| 250 | Glenwood | 8,603.0 | 8,731 | -1.5% | |||||
| 251 | Rock Falls | 8,587.0 | 9,237 | -7.0% | |||||
| 252 | Monmouth | 8,581.0 | 9,391 | -8.6% | |||||
| 253 | Olney | 8,577.0 | 8,758 | -2.1% | |||||
| 254 | Hampshire | 8,524.0 | 5,101 | 67.1% | |||||
| 255 | Crete | 8,386.0 | 8,442 | -0.7% | |||||
| 256 | Harrisburg | 8,372.0 | 8,933 | -6.3% | |||||
| 257 | Maryville | 8,316.0 | 7,029 | 18.3% | |||||
| 258 | Long Grove | 8,305.0 | 7,866 | 5.6% | |||||
| 259 | Paris | 8,276.0 | 9,028 | -8.3% | |||||
| 260 | Hillside | 8,084.0 | 8,088 | -0.0% | |||||
| 261 | Oak Brook | 8,056.0 | 7,905 | 1.9% | |||||
| 262 | Island Lake | 8,014.0 | 8,223 | -2.5% | |||||
| 263 | Lincolnshire | 7,980.0 | 7,077 | 12.8% | |||||
| 264 | Princeton | 7,975.0 | 7,884 | 1.2% | |||||
| 265 | Rockton | 7,974.0 | 7,287 | 9.4% | |||||
| 266 | Silvis | 7,955.0 | 7,435 | 7.0% | |||||
| 267 | South Beloit | 7,946.0 | 7,559 | 5.1% | |||||
| 268 | Round Lake Park | 7,919.0 | 7,232 | 9.5% | |||||
| 269 | West Dundee | 7,906.0 | 7,078 | 11.7% | |||||
| 270 | Broadview | 7,896.0 | 7,924 | -0.4% | |||||
| 271 | Park City | 7,827.0 | 7,600 | 3.0% | |||||
| 272 | Jerseyville | 7,445.0 | 8,495 | -12.4% | |||||
| 273 | University Park | 7,306.0 | 7,329 | -0.3% | |||||
| 274 | Inverness | 7,275.0 | 7,129 | 2.0% | |||||
| 275 | North Riverside | 7,249.0 | 6,660 | 8.8% | |||||
| 276 | Salem | 7,236.0 | 7,473 | -3.2% | |||||
| 277 | Greenville | 7,235.0 | 6,962 | 3.9% | |||||
| 278 | Sandwich | 7,219.0 | 7,707 | -6.3% | |||||
| 279 | West Frankfort | 7,118.0 | 8,700 | -18.2% | |||||
| 280 | Robinson | 7,084.0 | 7,807 | -9.3% | |||||
| 281 | Marengo | 7,040.0 | 7,881 | -10.7% | |||||
| 282 | Mendota | 6,994.0 | 7,274 | -3.8% | |||||
| 283 | Clinton | 6,985.0 | 7,362 | -5.1% | |||||
| 284 | Stickney | 6,952.0 | 6,608 | 5.2% | |||||
| 285 | Benton | 6,863.0 | 7,066 | -2.9% | |||||
| 286 | Calumet Park | 6,855.0 | 7,932 | -13.6% | |||||
| 287 | Mount Carmel | 6,854.0 | 7,437 | -7.8% | |||||
| 288 | Litchfield | 6,834.0 | 6,965 | -1.9% | |||||
| 289 | Chester | 6,797.0 | 8,510 | -20.1% | |||||
| 290 | Murphysboro | 6,735.0 | 8,375 | -19.6% | |||||
| 291 | Orland Hills | 6,719.0 | 7,011 | -4.2% | |||||
| 292 | Volo | 6,706.0 | 1,859 | 260.7% | |||||
| 293 | Geneseo | 6,673.0 | 6,476 | 3.0% | |||||
| 294 | Winthrop Harbor | 6,559.0 | 6,791 | -3.4% | |||||
| 295 | Lakemoor | 6,467.0 | 5,765 | 12.2% | |||||
| 296 | Johnsburg | 6,386.0 | 6,294 | 1.5% | |||||
| 297 | Elburn | 6,354.0 | 5,310 | 19.7% | |||||
| 298 | Monticello | 6,304.0 | 5,202 | 21.2% | |||||
| 299 | Countryside | 6,267.0 | 5,817 | 7.7% | |||||
| 300 | Beardstown | 6,169.0 | 5,994 | 2.9% | |||||
| 301 | Braidwood | 6,062.0 | 5,965 | 1.6% | |||||
| 302 | Lake Bluff | 6,041.0 | 6,035 | 0.1% | |||||
| 303 | Pontoon Beach | 6,025.0 | 6,054 | -0.5% | |||||
| 304 | Spring Grove | 5,917.0 | 5,214 | 13.5% | |||||
| 305 | Chillicothe | 5,900.0 | 6,268 | -5.9% | |||||
| 306 | Willow Springs | 5,868.0 | 5,344 | 9.8% | |||||
| 307 | Metropolis | 5,864.0 | 6,575 | -10.8% | |||||
| 308 | Bartonville | 5,841.0 | 6,397 | -8.7% | |||||
| 309 | Peoria Heights | 5,825.0 | 6,273 | -7.1% | |||||
| 310 | Carterville | 5,818.0 | 5,345 | 8.8% | |||||
| 311 | Hillsboro | 5,803.0 | 5,382 | 7.8% | |||||
| 312 | Vandalia | 5,796.0 | 5,833 | -0.6% | |||||
| 313 | Du Quoin | 5,726.0 | 6,169 | -7.2% | |||||
| 314 | East Alton | 5,689.0 | 6,415 | -11.3% | |||||
| 315 | Mount Zion | 5,660.0 | 5,244 | 7.9% | |||||
| 316 | Lake Holiday | 5,641.0 | 4,504 | 25.2% | |||||
| 317 | Wilmington | 5,494.0 | 5,712 | -3.8% | |||||
| 318 | Genoa | 5,492.0 | 5,529 | -0.7% | |||||
| 319 | Northfield | 5,487.0 | 5,429 | 1.1% | |||||
| 320 | Carlinville | 5,480.0 | 5,532 | -0.9% | |||||
| 321 | Spring Valley | 5,476.0 | 5,540 | -1.2% | |||||
| 322 | Candlewick Lake | 5,448.0 | 0 | nan% | |||||
| 323 | Lake Barrington | 5,442.0 | 4,840 | 12.4% | |||||
| 324 | Coal City | 5,317.0 | 5,428 | -2.0% | |||||
| 325 | Highwood | 5,301.0 | 5,452 | -2.8% | |||||
| 326 | Posen | 5,292.0 | 5,684 | -6.9% | |||||
| 327 | Grandwood Park | 5,262.0 | 4,998 | 5.3% | |||||
| 328 | Pana | 5,217.0 | 5,991 | -12.9% | |||||
| 329 | Berkeley | 5,199.0 | 5,159 | 0.8% | |||||
| 330 | Colona | 5,139.0 | 4,974 | 3.3% | |||||
| 331 | Monee | 5,108.0 | 4,916 | 3.9% | |||||
| 332 | Milan | 5,034.0 | 5,146 | -2.2% | |||||
| 333 | Hoopeston | 5,034.0 | 5,625 | -10.5% | |||||
| 334 | South Barrington | 5,021.0 | 4,385 | 14.5% | |||||
| 335 | Pinckneyville | 5,018.0 | 5,621 | -10.7% | |||||
| 336 | Eureka | 5,007.0 | 5,222 | -4.1% | |||||
| 337 | Carmi | 4,845.0 | 5,422 | -10.6% | |||||
| 338 | Palos Park | 4,816.0 | 4,785 | 0.6% | |||||
| 339 | Tuscola | 4,808.0 | 4,229 | 13.7% | |||||
| 340 | Watseka | 4,780.0 | 5,398 | -11.4% | |||||
| 341 | Olympia Fields | 4,734.0 | 4,718 | 0.3% | |||||
| 342 | Beecher | 4,728.0 | 4,646 | 1.8% | |||||
| 343 | Lakewood | 4,707.0 | 3,754 | 25.4% | |||||
| 344 | Creve Coeur | 4,621.0 | 5,328 | -13.3% | |||||
| 345 | Freeburg | 4,592.0 | 4,118 | 11.5% | |||||
| 346 | Peotone | 4,587.0 | 4,506 | 1.8% | |||||
| 347 | Cortland | 4,564.0 | 3,803 | 20.0% | |||||
| 348 | Fairfield | 4,561.0 | 5,644 | -19.2% | |||||
| 349 | Robbins | 4,556.0 | 5,282 | -13.7% | |||||
| 350 | Fox River Grove | 4,523.0 | 5,080 | -11.0% | |||||
| 351 | Stone Park | 4,482.0 | 4,930 | -9.1% | |||||
| 352 | Flora | 4,475.0 | 5,088 | -12.0% | |||||
| 353 | Lebanon | 4,474.0 | 4,045 | 10.6% | |||||
| 354 | Pittsfield | 4,420.0 | 4,694 | -5.8% | |||||
| 355 | Sherman | 4,386.0 | 3,639 | 20.5% | |||||
| 356 | Shelbyville | 4,351.0 | 5,324 | -18.3% | |||||
| 357 | Sullivan | 4,348.0 | 4,374 | -0.6% | |||||
| 358 | Auburn | 4,306.0 | 4,798 | -10.3% | |||||
| 359 | Breese | 4,301.0 | 4,552 | -5.5% | |||||
| 360 | Staunton | 4,298.0 | 4,871 | -11.8% | |||||
| 361 | Kildeer | 4,292.0 | 3,889 | 10.4% | |||||
| 362 | Wonder Lake | 4,292.0 | 3,562 | 20.5% | |||||
| 363 | Marseilles | 4,279.0 | 5,159 | -17.1% | |||||
| 364 | West Peoria | 4,238.0 | 4,502 | -5.9% | |||||
| 365 | Coal Valley | 4,229.0 | 3,455 | 22.4% | |||||
| 366 | Rosewood Heights | 4,229.0 | 4,343 | -2.6% | |||||
| 367 | Hometown | 4,215.0 | 4,324 | -2.5% | |||||
| 368 | Anna | 4,196.0 | 4,592 | -8.6% | |||||
| 369 | Metamora | 4,159.0 | 3,414 | 21.8% | |||||
| 370 | Paxton | 4,131.0 | 4,454 | -7.3% | |||||
| 371 | Caseyville | 4,130.0 | 3,960 | 4.3% | |||||
| 372 | Green Oaks | 4,096.0 | 3,832 | 6.9% | |||||
| 373 | Sparta | 4,068.0 | 4,352 | -6.5% | |||||
| 374 | Marshall | 4,040.0 | 3,857 | 4.7% | |||||
| 375 | Riverwoods | 4,013.0 | 3,920 | 2.4% | |||||
| 376 | Millstadt | 4,008.0 | 3,804 | 5.4% | |||||
| 377 | Indian Head Park | 3,974.0 | 3,795 | 4.7% | |||||
| 378 | Scott Afb | 3,957.0 | 4,679 | -15.4% | |||||
| 379 | Lawrenceville | 3,941.0 | 5,344 | -26.3% | |||||
| 380 | Burnham | 3,937.0 | 4,188 | -6.0% | |||||
| 381 | Poplar Grove | 3,923.0 | 5,084 | -22.8% | |||||
| 382 | South Chicago Heights | 3,907.0 | 4,073 | -4.1% | |||||
| 383 | Dupo | 3,879.0 | 4,077 | -4.9% | |||||
| 384 | Barrington Hills | 3,879.0 | 4,165 | -6.9% | |||||
| 385 | Dwight | 3,872.0 | 4,185 | -7.5% | |||||
| 386 | Oregon | 3,851.0 | 3,815 | 0.9% | |||||
| 387 | Red Bud | 3,782.0 | 3,668 | 3.1% | |||||
| 388 | St. Joseph | 3,778.0 | 3,504 | 7.8% | |||||
| 389 | Eldorado | 3,771.0 | 4,371 | -13.7% | |||||
| 390 | Rochester | 3,766.0 | 3,644 | 3.3% | |||||
| 391 | Cherry Valley | 3,749.0 | 3,271 | 14.6% | |||||
| 392 | Byron | 3,743.0 | 3,631 | 3.1% | |||||
| 393 | Morrison | 3,739.0 | 3,970 | -5.8% | |||||
| 394 | Fairbury | 3,713.0 | 3,842 | -3.4% | |||||
| 395 | Deer Park | 3,711.0 | 3,229 | 14.9% | |||||
| 396 | Fulton | 3,709.0 | 3,581 | 3.6% | |||||
| 397 | Wadsworth | 3,686.0 | 3,859 | -4.5% | |||||
| 398 | Smithton | 3,680.0 | 3,408 | 8.0% | |||||
| 399 | Aledo | 3,668.0 | 3,723 | -1.5% | |||||
| 400 | Oglesby | 3,570.0 | 3,357 | 6.3% | |||||
| 401 | Tolono | 3,566.0 | 3,614 | -1.3% | |||||
| 402 | Hainesville | 3,524.0 | 3,330 | 5.8% | |||||
| 403 | Riverton | 3,513.0 | 3,383 | 3.8% | |||||
| 404 | Forsyth | 3,502.0 | 3,288 | 6.5% | |||||
| 405 | New Baden | 3,463.0 | 3,367 | 2.9% | |||||
| 406 | Abingdon | 3,443.0 | 3,479 | -1.0% | |||||
| 407 | Germa | 3,436.0 | 3,238 | 6.1% | |||||
| 408 | Gibson City | 3,434.0 | 3,229 | 6.3% | |||||
| 409 | Westville | 3,419.0 | 3,195 | 7.0% | |||||
| 410 | Pistakee Highlands | 3,374.0 | 3,455 | -2.3% | |||||
| 411 | Johnston City | 3,327.0 | 3,567 | -6.7% | |||||
| 412 | Long Lake | 3,307.0 | 3,063 | 8.0% | |||||
| 413 | Momence | 3,291.0 | 3,562 | -7.6% | |||||
| 414 | Rosemont | 3,290.0 | 3,985 | -17.4% | |||||
| 415 | South Jacksonville | 3,239.0 | 3,346 | -3.2% | |||||
| 416 | Le Roy | 3,236.0 | 3,593 | -9.9% | |||||
| 417 | Knoxville | 3,211.0 | 2,866 | 12.0% | |||||
| 418 | Virden | 3,171.0 | 3,425 | -7.4% | |||||
| 419 | Sleepy Hollow | 3,161.0 | 3,412 | -7.4% | |||||
| 420 | East Dundee | 3,146.0 | 2,928 | 7.4% | |||||
| 421 | North Barrington | 3,143.0 | 3,044 | 3.3% | |||||
| 422 | Georgetown | 3,069.0 | 3,486 | -12.0% | |||||
| 423 | Ingalls Park | 3,015.0 | 3,684 | -18.2% | |||||
| 424 | Havana | 2,989.0 | 3,303 | -9.5% | |||||
| 425 | Diamond | 2,984.0 | 2,461 | 21.3% | |||||
| 426 | Winnebago | 2,981.0 | 3,215 | -7.3% | |||||
| 427 | Carlyle | 2,980.0 | 3,065 | -2.8% | |||||
| 428 | Dixmoor | 2,948.0 | 3,663 | -19.5% | |||||
| 429 | Nashville | 2,940.0 | 3,311 | -11.2% | |||||
| 430 | Newton | 2,932.0 | 2,855 | 2.7% | |||||
| 431 | Galena | 2,931.0 | 3,443 | -14.9% | |||||
| 432 | El Paso | 2,917.0 | 2,602 | 12.1% | |||||
| 433 | Madison | 2,900.0 | 4,378 | -33.8% | |||||
| 434 | Arcola | 2,892.0 | 2,804 | 3.1% | |||||
| 435 | Savanna | 2,816.0 | 3,112 | -9.5% | |||||
| 436 | Gillespie | 2,815.0 | 2,885 | -2.4% | |||||
| 437 | Holiday Shores | 2,782.0 | 2,446 | 13.7% | |||||
| 438 | Lena | 2,761.0 | 2,680 | 3.0% | |||||
| 439 | Davis Junction | 2,757.0 | 2,189 | 25.9% | |||||
| 440 | Rushville | 2,747.0 | 3,403 | -19.3% | |||||
| 441 | Pawnee | 2,738.0 | 2,576 | 6.3% | |||||
| 442 | Mount Morris | 2,726.0 | 3,345 | -18.5% | |||||
| 443 | Oakbrook Terrace | 2,723.0 | 2,224 | 22.4% | |||||
| 444 | Hamilton | 2,714.0 | 2,805 | -3.2% | |||||
| 445 | Bushnell | 2,677.0 | 3,134 | -14.6% | |||||
| 446 | Mcleansboro | 2,675.0 | 2,672 | 0.1% | |||||
| 447 | Trenton | 2,664.0 | 2,686 | -0.8% | |||||
| 448 | Richmond | 2,622.0 | 1,954 | 34.2% | |||||
| 449 | Fairmont | 2,617.0 | 2,044 | 28.0% | |||||
| 450 | Round Lake Heights | 2,592.0 | 2,865 | -9.5% | |||||
| 451 | Heyworth | 2,573.0 | 2,394 | 7.5% | |||||
| 452 | Christopher | 2,570.0 | 2,648 | -2.9% | |||||
| 453 | Wayne | 2,562.0 | 2,737 | -6.4% | |||||
| 454 | Rockdale | 2,553.0 | 1,954 | 30.7% | |||||
| 455 | Sheridan | 2,519.0 | 1,158 | 117.5% | |||||
| 456 | Kenilworth | 2,503.0 | 2,524 | -0.8% | |||||
| 457 | Polo | 2,495.0 | 2,385 | 4.6% | |||||
| 458 | Marquette Heights | 2,492.0 | 2,569 | -3.0% | |||||
| 459 | Fairmont City | 2,492.0 | 2,614 | -4.7% | |||||
| 460 | Carrollton | 2,479.0 | 2,625 | -5.6% | |||||
| 461 | Galva | 2,454.0 | 2,680 | -8.4% | |||||
| 462 | Tilton | 2,453.0 | 2,787 | -12.0% | |||||
| 463 | Seneca | 2,450.0 | 2,407 | 1.8% | |||||
| 464 | Preston Heights | 2,449.0 | 2,793 | -12.3% | |||||
| 465 | Henry | 2,441.0 | 2,475 | -1.4% | |||||
| 466 | Oakwood Hills | 2,416.0 | 2,021 | 19.5% | |||||
| 467 | Fox Lake Hills | 2,399.0 | 2,461 | -2.5% | |||||
| 468 | Aviston | 2,387.0 | 1,785 | 33.7% | |||||
| 469 | Amboy | 2,384.0 | 2,524 | -5.5% | |||||
| 470 | Tremont | 2,366.0 | 2,120 | 11.6% | |||||
| 471 | Lake Summerset | 2,364.0 | 1,758 | 34.5% | |||||
| 472 | Merrionette Park | 2,354.0 | 2,247 | 4.8% | |||||
| 473 | Villa Grove | 2,349.0 | 2,762 | -15.0% | |||||
| 474 | Petersburg | 2,341.0 | 2,093 | 11.8% | |||||
| 475 | Venetian Village | 2,334.0 | 3,060 | -23.7% | |||||
| 476 | Hinckley | 2,331.0 | 2,154 | 8.2% | |||||
| 477 | Elmwood | 2,327.0 | 2,205 | 5.5% | |||||
| 478 | Brighton | 2,306.0 | 2,101 | 9.8% | |||||
| 479 | Carthage | 2,291.0 | 2,640 | -13.2% | |||||
| 480 | Altamont | 2,282.0 | 2,086 | 9.4% | |||||
| 481 | White Hall | 2,257.0 | 2,515 | -10.3% | |||||
| 482 | Sumner | 2,252.0 | 1,984 | 13.5% | |||||
| 483 | Casey | 2,239.0 | 2,718 | -17.6% | |||||
| 484 | South Roxana | 2,181.0 | 2,368 | -7.9% | |||||
| 485 | Prairie Grove | 2,165.0 | 1,867 | 16.0% | |||||
| 486 | Catlin | 2,160.0 | 1,988 | 8.7% | |||||
| 487 | Mason City | 2,159.0 | 2,461 | -12.3% | |||||
| 488 | Carbon Cliff | 2,151.0 | 2,126 | 1.2% | |||||
| 489 | Nokomis | 2,147.0 | 2,376 | -9.6% | |||||
| 490 | Cambridge | 2,128.0 | 2,289 | -7.0% | |||||
| 491 | Lexington | 2,126.0 | 1,847 | 15.1% | |||||
| 492 | Bellevue | 2,106.0 | 2,107 | -0.0% | |||||
| 493 | Athens | 2,102.0 | 2,292 | -8.3% | |||||
| 494 | Lake Of The Woods | 2,091.0 | 3,061 | -31.7% | |||||
| 495 | Arthur | 2,083.0 | 2,798 | -25.6% | |||||
| 496 | Channel Lake | 2,052.0 | 1,793 | 14.4% | |||||
| 497 | Farmington | 2,050.0 | 2,420 | -15.3% | |||||
| 498 | Prestbury | 2,045.0 | 1,814 | 12.7% | |||||
| 499 | Pecatonica | 2,024.0 | 2,533 | -20.1% | |||||
| 500 | Sesser | 2,023.0 | 1,940 | 4.3% | |||||