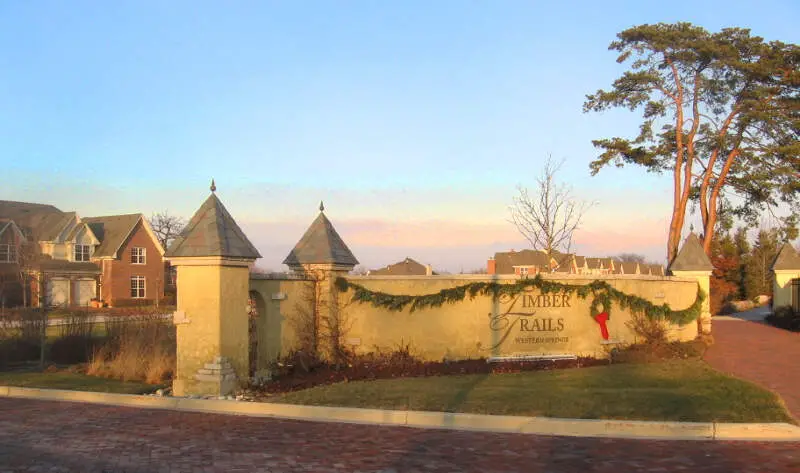
$230,255 median income · $863,783 median home · #1 best place in Illinois
Located between Chicago and Naperville, Western Springs is the best place to live in Illinois. Western Springs’ poverty level of 1.3% and unemployment rate of 3.1% are among the most impressive in the state. It’s not like people are just floating by here either, because at $230,255/year, Western Springs enjoys the 6th highest median household income statewide. And if you enjoy a side of culture with your cash, the Theatre of Western Springs is always putting on shows and plays. Western Springs is also known for its excellent schools and safe streets. In fact, there were only 1 violent crimes committed in Western Springs in 2026, which gives Western Springs the 8th lowest rate in Illinois. Even though violence is quite unlikely, Western Springs residents are prepared if it does come. That’s because 99.1% of folks in Western Springs have health insurance, which is the 8th highest rate in Illinois.
Data | Crime | Cost of living | Movers
$161,500 median income · $841,446 median home · #2 best place in Illinois
The 2nd best place to live in Illinois is Northfield, a quiet North Shore village of 5,487 residents.
Median household income of $161,500, unemployment at just 2.2%, and median home values around $841,446 earn it this place in the rankings. Not exactly a starter-home situation, but residents clearly think it’s worth every penny.
Kids here feed into the New Trier Township High School District, one of the most celebrated public school systems in the entire country. Of course, that’s what you’d expect in a premier North Shore community. With poverty at just 3.2%, this is one of the best Illinois suburbs where you can build a life.
Data | Crime | Cost of living | Movers
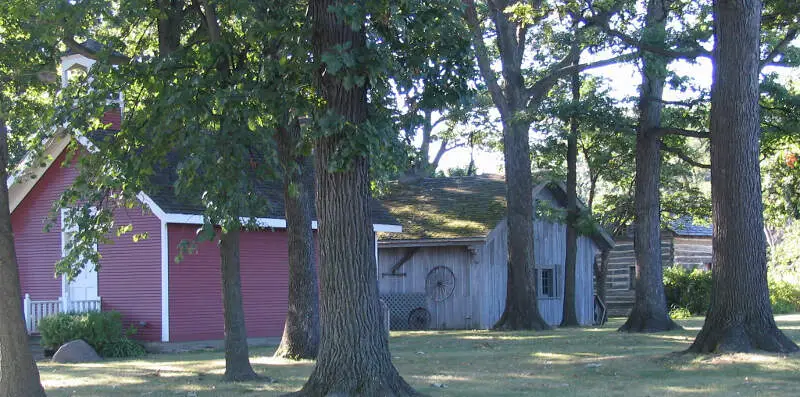
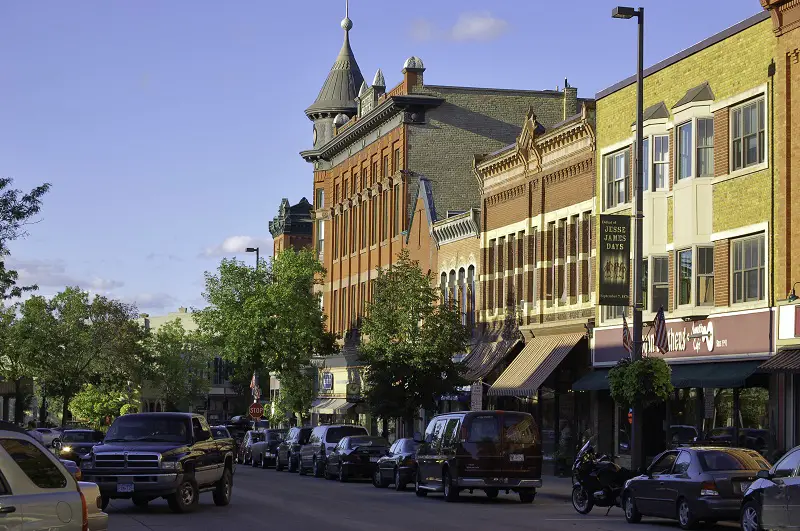
$181,660 median income · $635,444 median home · #3 best place in Illinois
We start our tour of the best places to call home in Illinois with Deerfield, a North Shore suburb of Chicago. Deerfield ranks as the 27th least violent place in the state and has a total crime rate about 70% below the national average. Deerfield’s economy is largely driven by the healthcare industry, as it is home to the headquarters of big name companies like Walgreens, Baxter, and Takeda Pharmaceuticals. If you’re working in one of those fields, you should have no trouble locking down a job here. And based on Deerfield’s rank as the 14th best-paid populace in the state, with a median household income of $181,660/year, we think you should do pretty well for yourself at that job. And with a sub-3% unemployment rate and poverty level, Deerfield’s economy is working at every level. For a village where healthcare looms large, it’s not surprising that 99.0% of residents have health insurance, one of the highest rates in Illinois. If you’re planning on moving with your family, or starting a family soon, know that Deerfield’s school district is among the best in the state, with GreatSchools awarding a 9/10 score or higher to every single public school in the area. Speaking of education, the local Historic Village is a staple of the Deerfield school experience that’s fun for the whole family. But if you’re looking for something a tad bit more modern, “The Square” in Deerfield’s downtown has everything you need to keep your shopaholism satisfied.
Data | Crime | Cost of living | Movers

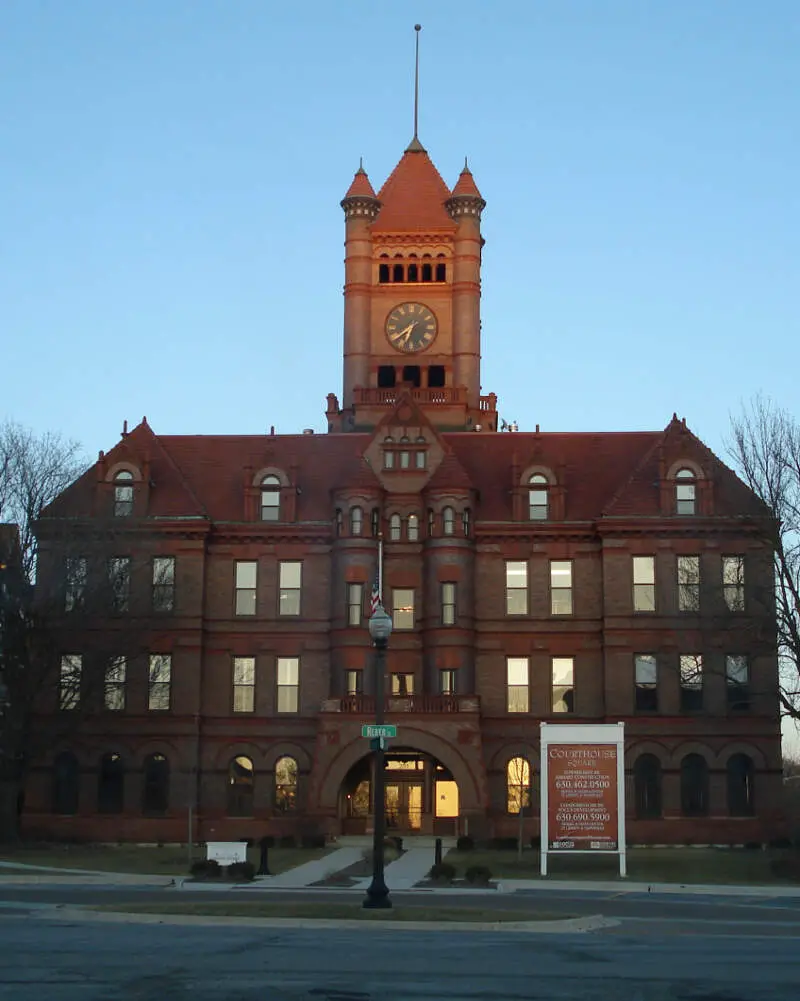
$250,001 median income · $1,244,308 median home · #4 best place in Illinois
We’re sticking around western Chi-Town suburbs for our 4th best place to call home in Illinois, the village of Hinsdale. People in Hinsdale know the importance of education, from start to finish. All the elementary schools in Hinsdale received a score of 9/10 from GreatSchools, and both the local middle school and high school got a perfect 10/10. That educational excellence is just one of the reasons we named Hinsdale as the best family city in Illinois. Seeing as over 40% of Hinsdale’s population has a master’s degree or higher, we think the success of early education carries over nicely into success later in life.
After all, Hinsdale does have the 2nd highest median household income in the state, $250,001/year. Which comes in handy when you’ve also got the 3rd priciest homes. And since smart, moneyed individuals rarely feel the need to engage in criminal activity, Hinsdale’s crime rate being about 80% below the national average makes a lot of sense.
If you’re craving a bit more action, though, Chicago’s downtown is just 20-minute train ride away, so you can be walking The Magnificent Mile any time you like.
Data | Crime | Cost of living | Movers

$153,686 median income · $547,998 median home · #5 best place in Illinois
Riverside, a pioneering planned suburb about 12 miles from Chicago, is known for its Riverside Landscape Architecture District, a National Historic Landmark designed by Frederick Law Olmsted and Calvert Vaux.
With a population of 9,039, this suburb in Cook County showcases diverse architectural treasures that draw design and history aficionados. Its affluence is evidenced by the impressive $547,998 median home value and high 153,686 median income. Low crime rates, with 0.0008 and 0.0075 violent and property crime rates per capita, ensure resident safety.
Data | Crime | Cost of living | Movers
$120,008 median income · $501,273 median home · #6 best place in Illinois
Wheaton earns its spot among the best places to live in Illinois the old-fashioned way, by just delivering across the board. A median household income of $120,008 and a poverty rate of only 5.6% paint the picture of a perfect suburb. Throw in a 3.7% unemployment rate and you’ve got a local economy that rarely leaves residents hanging.
The homes here average $501,273, but residents get a lot in return, including Cantigny Park’s 500 acres of gardens and the First Division Museum right in their own backyard. Not too shabby if you ask me, and easily one of the best Illinois cities to live in for 2026.
Data | Crime | Cost of living | Movers
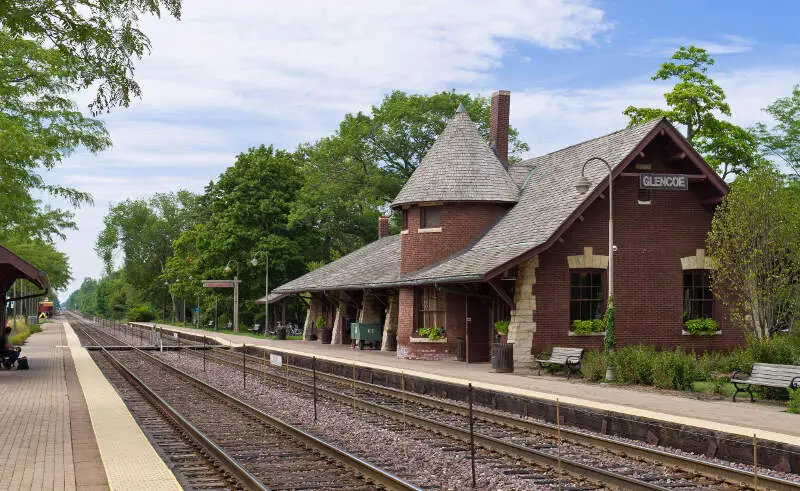
$248,933 median income · $1,577,965 median home · #7 best place in Illinois
Up next on our list of the best places to live in Illinois is Glencoe, one Chicago’s best suburbs. We also named Glencoe as the richest place in Illinois, so you might want to turn up with a lucrative job or substantial savings if you’re moving here soon.
Glencoe residents enjoy the 4th highest median income in Illinois at $248,933. Which is sort of necessary when you’re also paying the 2nd highest prices for homes in the state, with a median home value of $1,577,965.
But for the money, you get some of the best schools in the state — GreatSchools gave the village’s school’s an average rating of 8.5, and Glencoe enjoys the 6th lowest high school dropout rate in Illinois.
Besides being great on paper, Glencoe has loads to keep you occupied year-round. It’s home to the Chicago Botanical Garden, so there’s always time to stop and smell the roses here.
Residents also have access to Glencoe Beach for relaxation and the Writer’s Theatre for some heady entertainment. And heady entertainment is in high demand, considering 88% of adults in Glencoe are highly educated.
Data | Crime | Cost of living | Movers
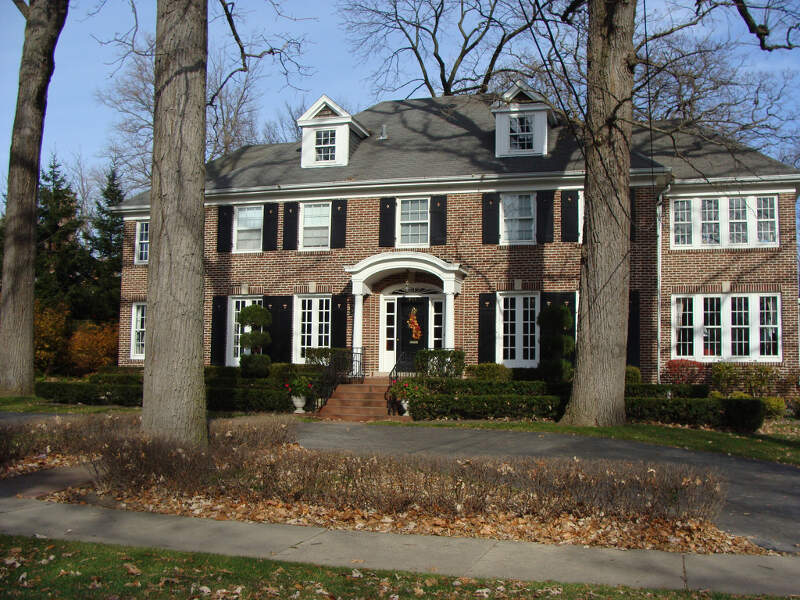
$250,001 median income · $1,818,305 median home · #8 best place in Illinois
We know we’ve been touting the wealth of some of the other communities on this list, but none of them holds a candle to Winnetka. Homes in Winnetka go for around $1,818,305, the 1st costliest in the state. If you want to buy the Home Alone house, it might set you back a bit more. That’s okay though, because Winnetka also has the 2nd highest median household income statewide at $250,001/year. With these kind of numbers, it’s not hard to see why we named Winnetka one of the richest places in Illinois.
Folks in Winnetka didn’t coincidentally end up in big homes with big salaries. Over 45% of residents have a master’s degree, PhD, or professional degree, so you’re looking at the result of years of hard work here. And it’s paid off for the whole community, which enjoys an unemployment rate and poverty level under 3%. Residents can spend their hard-earned free time fishing, kayaking, or hiking at Skokie Lagoons.
Data | Crime | Cost of living | Movers
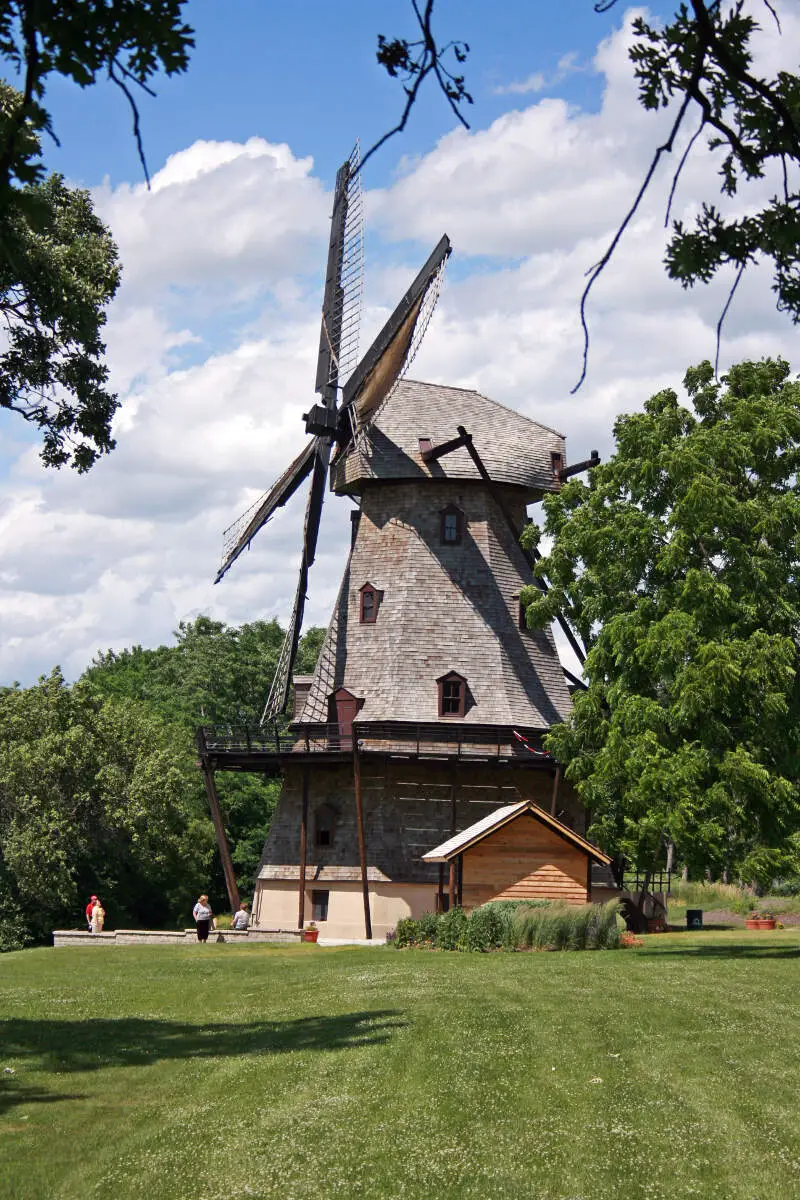
$144,341 median income · $532,206 median home · #9 best place in Illinois
At rank #9, Geneva has earned its place among Illinois’ best places to live by quietly building one of the more impressive resumes among suburbs in the state. An unemployment rate of just 1.8% and a poverty level of 3.8% make this town of 21,258 look almost embarrassingly stable.
The median household income comes in at $144,341/year. Pretty solid. Homes here average $532,206.
Data | Crime | Cost of living | Movers
$129,395 median income · $436,990 median home · #10 best place in Illinois
In what’s becoming a pattern, Buffalo Grove is yet another Chicago suburb to rank among the best places to live in Chicago. At 42,891, Buffalo Grove is the most populous place to make this list, so you won’t have to worry about being far from the action here. Especially with Fine Art Festival and the Buffalo Grove Days popping off every summer. You won’t have to worry about crime here either, because Buffalo Grove experienced the 22nd lowest amount of violent crime per capita in Illinois and had a total crime rate about 75% below the national average. And if you’ve got kiddos, you can feel confident sending them through one of the best educational systems in the state. With a median household income of $129,395/year and a median home price of $436,990, Buffalo Grove has the second lowest cost of living of places we’re covering on this list.
Data | Crime | Cost of living | Movers
The receipts
Compare the top ten
Pick a metric. The bars rescale. The red line is Illinois’s statewide median.
Illinois statewide median: $83,390
Illinois statewide median: $285,736
Illinois statewide median: 5.8%
On the map
Mapping The Best And Worst Places To Live in Illinois
Saturday Night Science
Methodology: How We Calculated The Best Cities To Live In Illinois
Before we even started to collect data on the best places to live in Illinois, we had to answer a tough question: Is it fair to pit cities with populations over 100,000 against places with a population of 18?
We firmly decided no, that just isn’t fair.
So, to create our ranking, we broke the best places to live into three tiers:
- Cities — Populations over 5,000
- Towns — Populations between 1,000 and 5,000
- Small Towns — Populations below 1,000
We then decided no matter how much anyone loves their town, the best cities to live in Illinois have more of everything, and therefore, you need over 5,000 people to truly be ‘the best.’
Now that we had our set of the best possible cities, it was time to rank them using Saturday Night Science.
We ranked each place in Illinois across a number of criteria from one to 323, with one being the best.
We then took the average rank across all criteria, crowning the city posting the lowest overall score, the “Best Place To Live In Illinois.”
The criteria we looked to determine the best places were:
- Median Home Values
- Median Income
- Population Density (Higher is better)
- Unemployment Rate
- Commute Time
- Crime
- Education Levels
- Health Insurance Coverage
- Poverty rates
Sources of criteria include the New Census Data, FBI Crime Data, and Zillow. We updated this article for 2026. This report is our eleventh time ranking Illinois’s best places to live.
If your city or town isn’t among the top 10, jump down to the bottom of the post to see a detailed chart of the best places in Illinois. Otherwise, buckle up for a ride down good living lane with Western Springs at the end of the cul-de-sac.
The full plate
Best Places To Live In Illinois Table
Click any column to sort. Search by city name.
| Rank | City | Best Score | Population | Unemployment Rate | Home Value | Median Income | Rent | Total Crime /100k |
|---|---|---|---|---|---|---|---|---|
| 1 | Western Springs | 40.40 | 13,446 | 3.1% | $863,783 | $230,255 | 275 | |
| 2 | Northfield | 53.60 | 5,487 | 2.2% | $841,446 | $161,500 | 784 | |
| 3 | Deerfield | 58.20 | 19,518 | 2.7% | $635,444 | $181,660 | 999 | |
| 4 | Hinsdale | 60.50 | 17,175 | 3.2% | $1,244,308 | $250,001 | 541 | |
| 5 | Riverside | 66.70 | 9,039 | 1.9% | $547,998 | $153,686 | 830 | |
| 6 | Wheaton | 66.80 | 53,557 | 3.7% | $501,273 | $120,008 | 581 | |
| 7 | Glencoe | 68.50 | 8,701 | 3.6% | $1,577,965 | $248,933 | 609 | |
| 8 | Winnetka | 68.65 | 12,484 | 3.4% | $1,818,305 | $250,001 | 721 | |
| 9 | Geneva | 69.00 | 21,258 | 1.8% | $532,206 | $144,341 | 579 | |
| 10 | Buffalo Grove | 70.70 | 42,891 | 2.7% | $436,990 | $129,395 | 727 | |
| 11 | Highland Park | 71.80 | 30,398 | 3.2% | $751,001 | $168,094 | 859 | |
| 12 | La Grange Park | 72.50 | 13,447 | 3.3% | $480,916 | $120,408 | 669 | |
| 13 | Northbrook | 72.60 | 34,585 | 3.2% | $688,265 | $157,782 | 1,191 | |
| 14 | Libertyville | 72.90 | 20,525 | 2.9% | $603,285 | $165,667 | 609 | |
| 15 | Inverness | 73.45 | 7,275 | 3.3% | $787,210 | $207,434 | 412 | |
| 16 | Lincolnshire | 75.40 | 7,980 | 2.2% | $714,055 | $185,580 | 952 | |
| 17 | Wilmette | 75.80 | 27,503 | 4.2% | $961,183 | $190,662 | 1,174 | |
| 18 | Troy | 76.05 | 11,647 | 3.1% | $324,854 | $112,434 | 455 | |
| 19 | La Grange | 76.30 | 15,998 | 2.2% | $639,655 | $159,929 | 931 | |
| 20 | Clarendon Hills | 76.80 | 8,659 | 3.2% | $666,351 | $130,388 | 427 | |
| 21 | South Barrington | 77.15 | 5,021 | 2.0% | $1,108,365 | $221,575 | 757 | |
| 22 | Elburn | 77.15 | 6,354 | 0.5% | $448,721 | $127,731 | 614 | |
| 23 | Lake Bluff | 77.65 | 6,041 | 4.4% | $633,530 | $204,000 | 795 | |
| 24 | Lake Forest | 78.50 | 19,416 | 1.8% | $1,167,578 | $235,081 | 644 | |
| 25 | Monticello | 80.65 | 6,304 | 0.5% | $267,358 | $99,449 | 222 | |
| 26 | Winfield | 81.00 | 10,095 | 5.6% | $456,207 | $135,795 | 406 | |
| 27 | Lake Zurich | 84.45 | 19,832 | 3.2% | $488,103 | $135,968 | 1,261 | |
| 28 | Batavia | 84.55 | 27,151 | 2.5% | $453,319 | $120,056 | 814 | |
| 29 | Bartlett | 85.95 | 40,501 | 2.6% | $430,326 | $133,240 | 410 | |
| 30 | Oswego | 86.35 | 36,375 | 2.6% | $416,738 | $123,792 | 610 | |
| 31 | Park Ridge | 87.40 | 38,667 | 4.2% | $564,905 | $142,986 | 913 | |
| 32 | Elmhurst | 87.60 | 45,671 | 4.3% | $613,207 | $149,644 | 874 | |
| 33 | New Lenox | 87.85 | 28,006 | 2.9% | $440,656 | $140,865 | 989 | |
| 34 | Burr Ridge | 89.20 | 11,141 | 3.4% | $828,471 | $156,829 | 880 | |
| 35 | Arlington Heights | 89.85 | 76,005 | 3.5% | $470,945 | $116,723 | 900 | |
| 36 | Manhattan | 89.95 | 11,026 | 1.5% | $385,490 | $128,522 | 227 | |
| 37 | Campton Hills | 90.50 | 10,877 | 5.0% | $666,624 | $209,134 | 55 | |
| 38 | Barrington | 91.40 | 11,077 | 2.8% | $613,360 | $147,989 | 867 | |
| 39 | Cary | 91.80 | 17,923 | 5.0% | $368,573 | $113,026 | 491 | |
| 40 | Chatham | 92.35 | 14,639 | 3.6% | $298,424 | $106,773 | 594 | |
| 41 | Naperville | 92.50 | 150,692 | 4.5% | $610,454 | $155,105 | 966 | |
| 42 | Mount Zion | 92.65 | 5,660 | 3.4% | $193,289 | $103,365 | 583 | |
| 43 | Glen Ellyn | 92.65 | 28,390 | 5.3% | $562,204 | $140,938 | 623 | |
| 44 | Lisle | 93.90 | 23,407 | 4.2% | $425,025 | $107,479 | 491 | |
| 45 | Glenview | 93.90 | 47,752 | 3.4% | $663,147 | $143,056 | 1,321 | |
| 46 | Lemont | 94.75 | 17,820 | 4.5% | $565,404 | $123,370 | 567 | |
| 47 | Downers Grove | 95.60 | 50,054 | 4.0% | $494,151 | $115,114 | 975 | |
| 48 | Frankfort | 95.80 | 20,651 | 4.1% | $487,132 | $154,375 | 717 | |
| 49 | Pingree Grove | 96.20 | 10,914 | 3.7% | $369,702 | $114,294 | 174 | |
| 50 | Palos Heights | 96.50 | 12,152 | 3.6% | $389,153 | $108,740 | 864 | |
| 51 | Mokena | 97.40 | 20,021 | 4.1% | $443,959 | $123,889 | 809 | |
| 52 | Gilberts | 98.80 | 8,606 | 3.7% | $409,641 | $146,333 | 256 | |
| 53 | Hawthorn Woods | 98.85 | 9,143 | 5.7% | $727,356 | $219,631 | 142 | |
| 54 | Rockton | 98.95 | 7,974 | 3.1% | $288,100 | $119,058 | 865 | |
| 55 | Vernon Hills | 100.20 | 26,876 | 3.2% | $448,031 | $121,943 | 1,511 | |
| 56 | Itasca | 100.65 | 9,355 | 2.6% | $443,025 | $114,294 | 791 | |
| 57 | Westchester | 102.90 | 16,436 | 5.2% | $357,237 | $98,954 | 657 | |
| 58 | Minooka | 104.50 | 12,891 | 4.2% | $364,409 | $115,445 | 341 | |
| 59 | Sugar Grove | 104.70 | 9,240 | 5.3% | $445,737 | $121,207 | 357 | |
| 60 | Brookfield | 105.00 | 19,331 | 3.3% | $345,445 | $110,295 | 698 | |
| 61 | West Dundee | 108.40 | 7,906 | 3.3% | $411,113 | $105,368 | 1,113 | |
| 62 | Long Grove | 109.15 | 8,305 | 2.1% | $924,481 | $250,001 | 2,373 | |
| 63 | Darien | 109.45 | 21,879 | 3.9% | $449,623 | $111,215 | 946 | |
| 64 | Mahomet | 109.70 | 10,049 | 3.5% | $339,545 | $118,586 | 458 | |
| 65 | Plainfield | 110.00 | 46,708 | 3.8% | $421,481 | $144,000 | 766 | |
| 66 | Huntley | 111.65 | 28,005 | 3.6% | $417,547 | $88,536 | 464 | |
| 67 | Highland | 112.60 | 10,262 | 1.0% | $267,000 | $82,551 | 711 | |
| 68 | River Forest | 112.70 | 11,992 | 8.1% | $716,652 | $146,786 | 2,368 | |
| 69 | Lindenhurst | 113.40 | 14,417 | 6.7% | $347,218 | $131,474 | 187 | |
| 70 | St. Charles | 113.70 | 32,854 | 4.1% | $463,142 | $114,300 | 1,144 | |
| 71 | Homer Glen | 113.80 | 24,529 | 4.6% | $505,179 | $136,678 | 294 | |
| 72 | Algonquin | 113.90 | 30,067 | 4.1% | $406,940 | $134,525 | 1,247 | |
| 73 | Columbia | 114.05 | 11,127 | 1.4% | $342,742 | $107,606 | 1,444 | |
| 74 | Willow Springs | 114.20 | 5,868 | 4.6% | $386,669 | $103,583 | 375 | |
| 75 | Manteno | 115.75 | 9,030 | 2.9% | $307,923 | $97,634 | 520 | |
| 76 | Grayslake | 116.35 | 20,929 | 5.4% | $361,376 | $113,972 | 822 | |
| 77 | Geneseo | 117.15 | 6,673 | 3.5% | $238,661 | $70,147 | 929 | |
| 78 | Sycamore | 117.85 | 18,559 | 3.0% | $313,784 | $84,120 | 1,061 | |
| 79 | Lockport | 118.90 | 26,409 | 4.7% | $360,599 | $111,981 | 666 | |
| 80 | Lake in the Hills | 119.10 | 28,800 | 5.9% | $369,917 | $117,151 | 503 | |
| 81 | Lombard | 119.50 | 43,619 | 4.4% | $380,912 | $100,362 | 1,715 | |
| 82 | Washington | 119.80 | 15,919 | 1.0% | $226,355 | $95,179 | 1,212 | |
| 83 | Bloomingdale | 119.80 | 22,457 | 4.6% | $428,844 | $102,928 | 1,447 | |
| 84 | Westmont | 120.35 | 23,724 | 4.0% | $400,412 | $88,090 | 1,109 | |
| 85 | Glen Carbon | 121.40 | 13,977 | 4.4% | $331,015 | $97,168 | 1,159 | |
| 86 | Spring Grove | 123.40 | 5,917 | 7.3% | $406,655 | $134,210 | 389 | |
| 87 | Mount Prospect | 123.80 | 55,472 | 3.8% | $433,814 | $101,720 | 943 | |
| 88 | Maryville | 124.05 | 8,316 | 6.2% | $325,041 | $100,670 | 349 | |
| 89 | Yorkville | 124.15 | 23,617 | 3.6% | $399,862 | $108,513 | 504 | |
| 90 | Hampshire | 124.40 | 8,524 | 2.5% | $407,967 | $94,773 | 375 | |
| 91 | O’Fallon | 125.10 | 32,262 | 3.7% | $308,471 | $105,982 | 1,200 | |
| 92 | Morton | 125.20 | 16,595 | 2.8% | $280,241 | $94,402 | 964 | |
| 93 | Mundelein | 126.20 | 31,915 | 2.6% | $380,533 | $108,340 | 771 | |
| 94 | Carol Stream | 126.20 | 39,460 | 3.9% | $377,328 | $102,309 | 765 | |
| 95 | Waterloo | 127.20 | 11,129 | 2.3% | $327,508 | $98,711 | 1,444 | |
| 96 | Shorewood | 127.30 | 18,343 | 6.6% | $403,278 | $122,105 | 916 | |
| 97 | Gurnee | 127.85 | 30,510 | 4.8% | $368,528 | $119,628 | 2,373 | |
| 98 | Colona | 128.50 | 5,139 | 0.6% | $177,130 | $79,700 | 876 | |
| 99 | Edwardsville | 129.00 | 26,474 | 4.6% | $324,629 | $86,721 | 718 | |
| 100 | Volo | 129.15 | 6,706 | 2.6% | $366,347 | $160,792 | 2,373 |
Source: U.S. Census ACS 2020-2024, FBI UCR, Zillow research. 323 places with more than 5,000 residents.
Summary
Summary: The Best Places In Illinois
If you’re looking at areas in Illinois with the best economic situations, where there’s lower than average crime, and a lot to do, this is an accurate list.
The best places to live in Illinois are Western Springs, Northfield, Deerfield, Hinsdale, Riverside, Wheaton, Glencoe, Winnetka, Geneva, and Buffalo Grove.
Western Springs made a strong showing to take in the overall number one spot for the best place to live in Illinois for 2026.


