Blue Island SnackAbility
Overall SnackAbility
Crime in Blue Island summary. We use data from the FBI to determine the crime rates in Blue Island. Key points include:
There were 661 total crimes in Blue Island in the last reporting year.
The overall crime rate per 100,000 people in Blue Island is 3,121.0 / 100k people.
The violent crime rate per 100,000 people in Blue Island is 434.4 / 100k people.
The property crime rate per 100,000 people in Blue Island is 2,686.6 / 100k people.
Overall, crime in Blue Island is 47.27% above the national average.
Total Crimes
Above National Average
Crime In Blue Island Comparison Table
| Statistic | Count Raw |
Blue Island / 100k People |
Illinois / 100k People |
National / 100k People |
|---|---|---|---|---|
| Total Crimes Per 100K | 661 | 3,121.0 | 2,004.4 | 2,119.2 |
| Violent Crime | 92 | 434.4 | 289.2 | 359.0 |
| Murder | 3 | 14.2 | 5.8 | 5.0 |
| Robbery | 23 | 108.6 | 90.2 | 61.0 |
| Aggravated Assault | 55 | 259.7 | 146.3 | 256.0 |
| Property Crime | 569 | 2,686.6 | 1,715.2 | 1,760.0 |
| Burglary | 136 | 642.1 | 290.5 | 229.0 |
| Larceny | 260 | 1,227.6 | 1,134.4 | 1,272.0 |
| Car Theft | 173 | 816.8 | 290.4 | 259.0 |
Source: FBI Uniform Crime Reporting (2024)
Cost of living in Blue Island summary. We use data on the cost of living to determine how expensive it is to live in Blue Island. Real estate prices drive most of the variance in cost of living around Illinois. Key points include:
The cost of living in Blue Island is 94 with 100 being average.
The cost of living in Blue Island is 0.9x lower than the national average.
The median home value in Blue Island is $196,177.
The median income in Blue Island is $59,489.
Blue Island's Overall Cost Of Living
Lower Than The National Average
Cost Of Living In Blue Island Comparison Table
| Living Expense | Blue Island | Illinois | National Average |
|---|---|---|---|
| Overall | 94 | 98 | 100 |
| Services | 100 | 99 | 100 |
| Groceries | 99 | 99 | 100 |
| Health | 77 | 96 | 100 |
| Housing | 105 | 101 | 100 |
| Transportation | 100 | 99 | 100 |
| Utilities | 103 | 101 | 100 |
Source: Cost of living index, normalized to US average = 100
Blue Island, IL Weather
The average high in Blue Island is 59.6° and the average low is 42.2°.
There are 72.8 days of precipitation each year.
Expect an average of 38.7 inches of precipitation each year with 31.8 inches of snow.
| Stat | Blue Island |
|---|---|
| Average Annual High | 59.6 |
| Average Annual Low | 42.2 |
| Annual Precipitation Days | 72.8 |
| Average Annual Precipitation | 38.7 |
| Average Annual Snowfall | 31.8 |
Average High
Days of Rain
Source: NOAA climate normals (30-year)
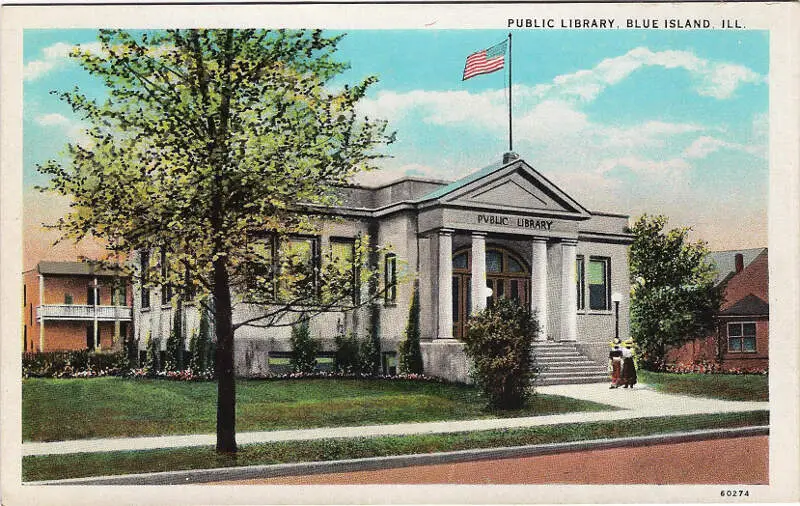
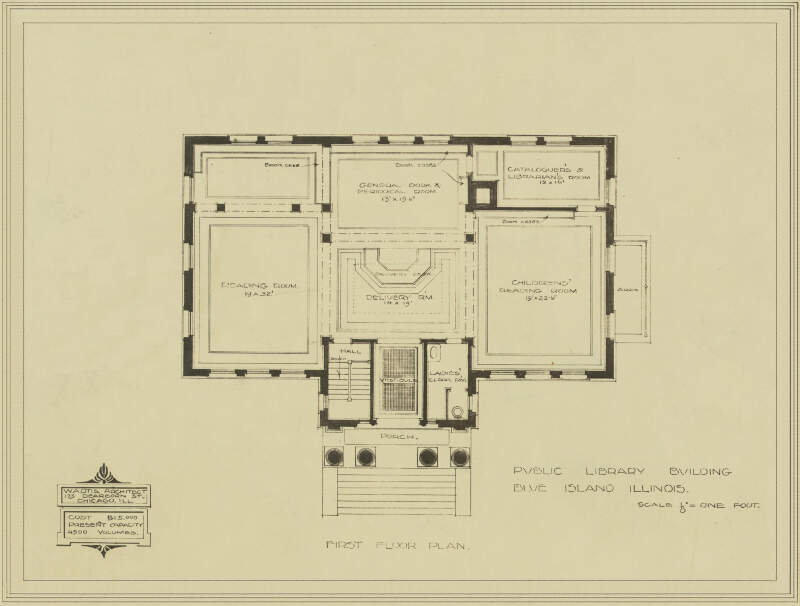
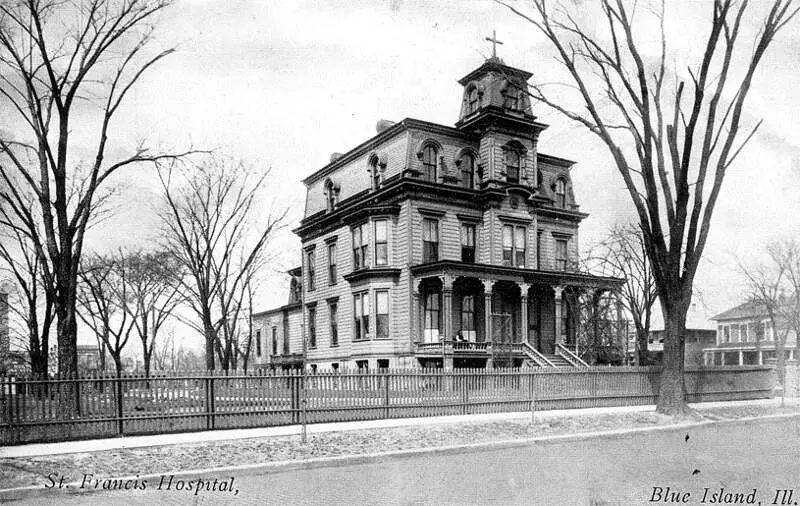
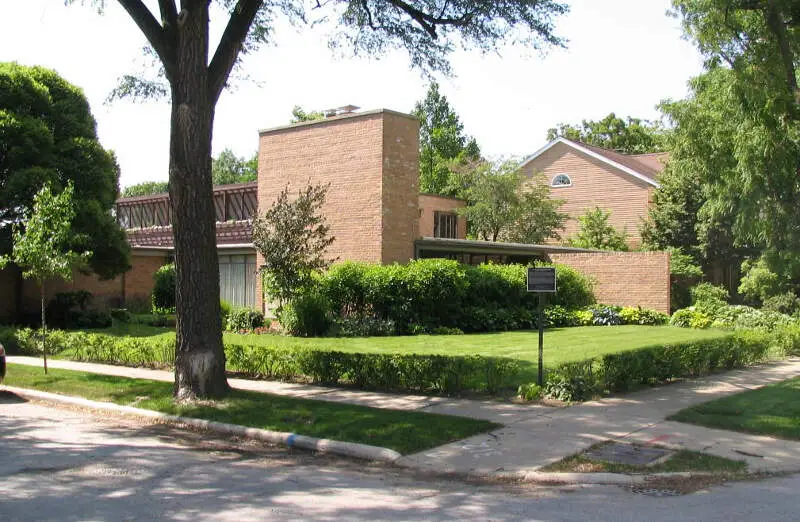
Blue Island, IL Photos

Rankings & Articles For Blue Island


Locations Around Blue Island
Map Of Blue Island, IL
Best Places Around Blue Island
Hinsdale, IL
Population 17,175
Clarendon Hills, IL
Population 8,659
Burr Ridge, IL
Population 11,141
Darien, IL
Population 21,879
La Grange, IL
Population 15,998
Western Springs, IL
Population 13,446
Downers Grove, IL
Population 50,054
Tinley Park, IL
Population 54,842
Westmont, IL
Population 23,724
River Forest, IL
Population 11,992
Blue Island Demographics And Statistics
Population over time in Blue Island
The current population in Blue Island is 21,741. The population has decreased 5.4% from 2010.
| Year | Population | % Change |
|---|---|---|
| 2024 | 21,741 | -7.2% |
| 2023 | 23,416 | 2.1% |
| 2022 | 22,934 | 0.0% |
| 2021 | 22,934 | -1.0% |
| 2020 | 23,160 | 2.4% |
| 2019 | 22,611 | -0.1% |
| 2018 | 22,636 | 0.8% |
| 2017 | 22,446 | 0.0% |
| 2016 | 22,446 | -2.8% |
| 2015 | 23,096 | -1.5% |
| 2014 | 23,453 | -0.7% |
| 2013 | 23,621 | 0.7% |
| 2012 | 23,457 | -0.3% |
| 2011 | 23,520 | 2.3% |
| 2010 | 22,990 | - |
Race / Ethnicity in Blue Island
See the full breakdown
Blue Island is:
18.0% White with 3,909 White residents.
30.7% African American with 6,681 African American residents.
0.0% American Indian with 0 American Indian residents.
0.6% Asian with 136 Asian residents.
0.0% Hawaiian with 0 Hawaiian residents.
0.0% Other with 0 Other residents.
3.2% Two Or More with 689 Two Or More residents.
47.5% Hispanic with 10,326 Hispanic residents.
| Race | Blue Island | IL | USA |
|---|---|---|---|
| White | 18.0% | 58.1% | 57.4% |
| African American | 30.7% | 13.3% | 11.9% |
| American Indian | 0.0% | 0.1% | 0.5% |
| Asian | 0.6% | 5.9% | 5.9% |
| Hawaiian | 0.0% | 0.0% | 0.2% |
| Other | 0.0% | 0.4% | 0.6% |
| Two Or More | 3.2% | 3.4% | 4.3% |
| Hispanic | 47.5% | 18.8% | 19.3% |
Gender in Blue Island
See the full breakdown
Blue Island is 49.2% female with 10,698 female residents.
Blue Island is 50.8% male with 11,042 male residents.
| Gender | Blue Island | IL | USA |
|---|---|---|---|
| Female | 49.2% | 50.6% | 50.5% |
| Male | 50.8% | 49.4% | 49.5% |
Highest level of educational attainment in Blue Island for adults over 25
See the full breakdown
13.0% of adults in Blue Island completed < 9th grade.
7.0% of adults in Blue Island completed 9-12th grade.
31.0% of adults in Blue Island completed high school / ged.
23.0% of adults in Blue Island completed some college.
6.0% of adults in Blue Island completed associate's degree.
13.0% of adults in Blue Island completed bachelor's degree.
7.0% of adults in Blue Island completed master's degree.
0.0% of adults in Blue Island completed professional degree.
0.0% of adults in Blue Island completed doctorate degree.
| Education | Blue Island | IL | USA |
|---|---|---|---|
| < 9th Grade | 13.0% | 5.0% | 4.0% |
| 9-12th Grade | 7.0% | 5.0% | 6.0% |
| High School / GED | 31.0% | 25.0% | 26.0% |
| Some College | 23.0% | 19.0% | 19.0% |
| Associate's Degree | 6.0% | 8.0% | 9.0% |
| Bachelor's Degree | 13.0% | 23.0% | 22.0% |
| Master's Degree | 7.0% | 11.0% | 10.0% |
| Professional Degree | 0.0% | 2.0% | 2.0% |
| Doctorate Degree | 0.0% | 2.0% | 2.0% |
Household Income For Blue Island, Illinois
See the full breakdown
10.0% of households in Blue Island earn Less than $10,000.
4.2% of households in Blue Island earn $10,000 to $14,999.
8.2% of households in Blue Island earn $15,000 to $24,999.
9.6% of households in Blue Island earn $25,000 to $34,999.
12.3% of households in Blue Island earn $35,000 to $49,999.
18.7% of households in Blue Island earn $50,000 to $74,999.
13.3% of households in Blue Island earn $75,000 to $99,999.
15.4% of households in Blue Island earn $100,000 to $149,999.
4.0% of households in Blue Island earn $150,000 to $199,999.
4.2% of households in Blue Island earn $200,000 or more.
| Income | Blue Island | IL | USA |
|---|---|---|---|
| Less than $10,000 | 10.0% | 5.4% | 5.0% |
| $10,000 to $14,999 | 4.2% | 3.2% | 3.4% |
| $15,000 to $24,999 | 8.2% | 5.9% | 6.3% |
| $25,000 to $34,999 | 9.6% | 6.3% | 6.6% |
| $35,000 to $49,999 | 12.3% | 9.7% | 10.1% |
| $50,000 to $74,999 | 18.7% | 14.8% | 15.5% |
| $75,000 to $99,999 | 13.3% | 12.6% | 12.6% |
| $100,000 to $149,999 | 15.4% | 18.0% | 17.5% |
| $150,000 to $199,999 | 4.0% | 10.1% | 9.6% |
| $200,000 or more | 4.2% | 13.8% | 13.4% |
Source: U.S. Census ACS 5-year estimates (2024)


