Burbank SnackAbility
Overall SnackAbility
Crime in Burbank summary. We use data from the FBI to determine the crime rates in Burbank. Key points include:
There were 601 total crimes in Burbank in the last reporting year.
The overall crime rate per 100,000 people in Burbank is 2,163.1 / 100k people.
The violent crime rate per 100,000 people in Burbank is 198.0 / 100k people.
The property crime rate per 100,000 people in Burbank is 1,965.2 / 100k people.
Overall, crime in Burbank is 2.07% above the national average.
Total Crimes
Above National Average
Crime In Burbank Comparison Table
| Statistic | Count Raw |
Burbank / 100k People |
Illinois / 100k People |
National / 100k People |
|---|---|---|---|---|
| Total Crimes Per 100K | 601 | 2,163.1 | 2,004.4 | 2,119.2 |
| Violent Crime | 55 | 198.0 | 289.2 | 359.0 |
| Murder | 0 | 0.0 | 5.8 | 5.0 |
| Robbery | 17 | 61.2 | 90.2 | 61.0 |
| Aggravated Assault | 23 | 82.8 | 146.3 | 256.0 |
| Property Crime | 546 | 1,965.2 | 1,715.2 | 1,760.0 |
| Burglary | 106 | 381.5 | 290.5 | 229.0 |
| Larceny | 359 | 1,292.1 | 1,134.4 | 1,272.0 |
| Car Theft | 81 | 291.5 | 290.4 | 259.0 |
Source: FBI Uniform Crime Reporting (2024)
Cost of living in Burbank summary. We use data on the cost of living to determine how expensive it is to live in Burbank. Real estate prices drive most of the variance in cost of living around Illinois. Key points include:
The cost of living in Burbank is 104 with 100 being average.
The cost of living in Burbank is 1.0x higher than the national average.
The median home value in Burbank is $302,037.
The median income in Burbank is $80,116.
Burbank's Overall Cost Of Living
Higher Than The National Average
Cost Of Living In Burbank Comparison Table
| Living Expense | Burbank | Illinois | National Average |
|---|---|---|---|
| Overall | 104 | 98 | 100 |
| Services | 102 | 99 | 100 |
| Groceries | 101 | 99 | 100 |
| Health | 112 | 96 | 100 |
| Housing | 107 | 101 | 100 |
| Transportation | 99 | 99 | 100 |
| Utilities | 103 | 101 | 100 |
Source: Cost of living index, normalized to US average = 100
Burbank, IL Weather
The average high in Burbank is 59.1° and the average low is 42.0°.
There are 72.6 days of precipitation each year.
Expect an average of 38.2 inches of precipitation each year with 34.2 inches of snow.
| Stat | Burbank |
|---|---|
| Average Annual High | 59.1 |
| Average Annual Low | 42.0 |
| Annual Precipitation Days | 72.6 |
| Average Annual Precipitation | 38.2 |
| Average Annual Snowfall | 34.2 |
Average High
Days of Rain
Source: NOAA climate normals (30-year)
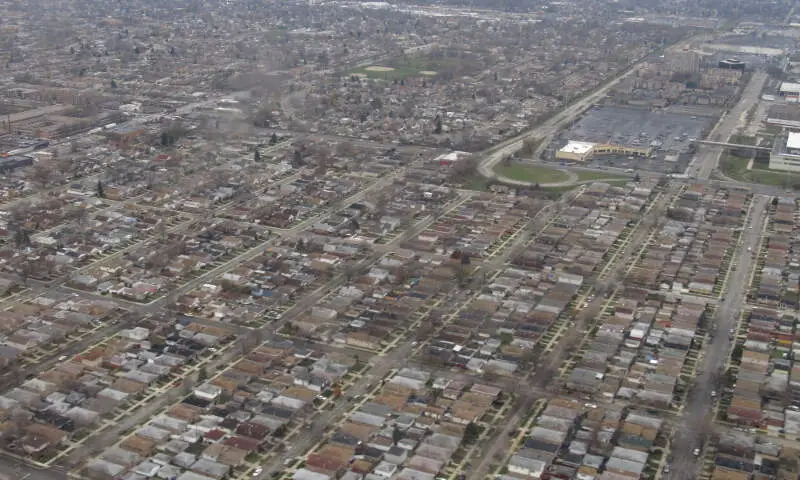
Burbank, IL Photos
1 Reviews & Comments About Burbank

No high school, but there is an elementary school. There is a high school in a neighboring town you can attend. Burbank is small, but close to Chicago and Midway Airport. They also have a recreation center and gym that was built a few years ago. Attached to the rec center is a small water park. It's always busy in the summer.
The waterpark and park is a popular place in the summer. If you are a resident, it is really cheap to get tickets. Residency also gives you reduced prices for their gym and recreation center. The gym/rec center provides classes, hydrotherapy, and massages.
Rankings & Articles For Burbank


Locations Around Burbank
Map Of Burbank, IL
Best Places Around Burbank
Hinsdale, IL
Population 17,175
Elmhurst, IL
Population 45,671
Clarendon Hills, IL
Population 8,659
Park Ridge, IL
Population 38,667
Glen Ellyn, IL
Population 28,390
Wheaton, IL
Population 53,557
Burr Ridge, IL
Population 11,141
Darien, IL
Population 21,879
Lisle, IL
Population 23,407
La Grange, IL
Population 15,998
Burbank Demographics And Statistics
Population over time in Burbank
The current population in Burbank is 28,739. The population has increased 1.1% from 2010.
| Year | Population | % Change |
|---|---|---|
| 2024 | 28,739 | -0.3% |
| 2023 | 28,822 | -1.0% |
| 2022 | 29,122 | -0.6% |
| 2021 | 29,312 | 3.0% |
| 2020 | 28,447 | -1.0% |
| 2019 | 28,729 | -0.8% |
| 2018 | 28,947 | -0.5% |
| 2017 | 29,081 | -0.0% |
| 2016 | 29,087 | -0.2% |
| 2015 | 29,157 | 0.2% |
| 2014 | 29,097 | 0.4% |
| 2013 | 28,993 | 0.5% |
| 2012 | 28,851 | 0.7% |
| 2011 | 28,655 | 0.8% |
| 2010 | 28,427 | - |
Race / Ethnicity in Burbank
See the full breakdown
Burbank is:
41.6% White with 11,956 White residents.
1.9% African American with 540 African American residents.
0.0% American Indian with 0 American Indian residents.
3.2% Asian with 920 Asian residents.
0.0% Hawaiian with 0 Hawaiian residents.
0.8% Other with 237 Other residents.
1.4% Two Or More with 413 Two Or More residents.
51.1% Hispanic with 14,673 Hispanic residents.
| Race | Burbank | IL | USA |
|---|---|---|---|
| White | 41.6% | 58.1% | 57.4% |
| African American | 1.9% | 13.3% | 11.9% |
| American Indian | 0.0% | 0.1% | 0.5% |
| Asian | 3.2% | 5.9% | 5.9% |
| Hawaiian | 0.0% | 0.0% | 0.2% |
| Other | 0.8% | 0.4% | 0.6% |
| Two Or More | 1.4% | 3.4% | 4.3% |
| Hispanic | 51.1% | 18.8% | 19.3% |
Gender in Burbank
See the full breakdown
Burbank is 50.1% female with 14,389 female residents.
Burbank is 49.9% male with 14,350 male residents.
| Gender | Burbank | IL | USA |
|---|---|---|---|
| Female | 50.1% | 50.6% | 50.5% |
| Male | 49.9% | 49.4% | 49.5% |
Highest level of educational attainment in Burbank for adults over 25
See the full breakdown
13.0% of adults in Burbank completed < 9th grade.
9.0% of adults in Burbank completed 9-12th grade.
37.0% of adults in Burbank completed high school / ged.
20.0% of adults in Burbank completed some college.
6.0% of adults in Burbank completed associate's degree.
11.0% of adults in Burbank completed bachelor's degree.
4.0% of adults in Burbank completed master's degree.
0.0% of adults in Burbank completed professional degree.
0.0% of adults in Burbank completed doctorate degree.
| Education | Burbank | IL | USA |
|---|---|---|---|
| < 9th Grade | 13.0% | 5.0% | 4.0% |
| 9-12th Grade | 9.0% | 5.0% | 6.0% |
| High School / GED | 37.0% | 25.0% | 26.0% |
| Some College | 20.0% | 19.0% | 19.0% |
| Associate's Degree | 6.0% | 8.0% | 9.0% |
| Bachelor's Degree | 11.0% | 23.0% | 22.0% |
| Master's Degree | 4.0% | 11.0% | 10.0% |
| Professional Degree | 0.0% | 2.0% | 2.0% |
| Doctorate Degree | 0.0% | 2.0% | 2.0% |
Household Income For Burbank, Illinois
See the full breakdown
3.3% of households in Burbank earn Less than $10,000.
3.0% of households in Burbank earn $10,000 to $14,999.
7.9% of households in Burbank earn $15,000 to $24,999.
5.9% of households in Burbank earn $25,000 to $34,999.
13.3% of households in Burbank earn $35,000 to $49,999.
13.7% of households in Burbank earn $50,000 to $74,999.
13.0% of households in Burbank earn $75,000 to $99,999.
20.0% of households in Burbank earn $100,000 to $149,999.
10.7% of households in Burbank earn $150,000 to $199,999.
9.1% of households in Burbank earn $200,000 or more.
| Income | Burbank | IL | USA |
|---|---|---|---|
| Less than $10,000 | 3.3% | 5.4% | 5.0% |
| $10,000 to $14,999 | 3.0% | 3.2% | 3.4% |
| $15,000 to $24,999 | 7.9% | 5.9% | 6.3% |
| $25,000 to $34,999 | 5.9% | 6.3% | 6.6% |
| $35,000 to $49,999 | 13.3% | 9.7% | 10.1% |
| $50,000 to $74,999 | 13.7% | 14.8% | 15.5% |
| $75,000 to $99,999 | 13.0% | 12.6% | 12.6% |
| $100,000 to $149,999 | 20.0% | 18.0% | 17.5% |
| $150,000 to $199,999 | 10.7% | 10.1% | 9.6% |
| $200,000 or more | 9.1% | 13.8% | 13.4% |
Source: U.S. Census ACS 5-year estimates (2024)


