Harvey SnackAbility
Overall SnackAbility
Cost of living in Harvey summary. We use data on the cost of living to determine how expensive it is to live in Harvey. Real estate prices drive most of the variance in cost of living around Illinois. Key points include:
The cost of living in Harvey is 88 with 100 being average.
The cost of living in Harvey is 0.9x lower than the national average.
The median home value in Harvey is $100,310.
The median income in Harvey is $42,429.
Harvey's Overall Cost Of Living
Lower Than The National Average
Cost Of Living In Harvey Comparison Table
| Living Expense | Harvey | Illinois | National Average |
|---|---|---|---|
| Overall | 88 | 98 | 100 |
| Services | 101 | 99 | 100 |
| Groceries | 95 | 99 | 100 |
| Health | 56 | 96 | 100 |
| Housing | 96 | 101 | 100 |
| Transportation | 98 | 99 | 100 |
| Utilities | 105 | 101 | 100 |
Source: Cost of living index, normalized to US average = 100
Harvey, IL Weather
The average high in Harvey is 59.1° and the average low is 42.0°.
There are 72.6 days of precipitation each year.
Expect an average of 38.2 inches of precipitation each year with 34.2 inches of snow.
| Stat | Harvey |
|---|---|
| Average Annual High | 59.1 |
| Average Annual Low | 42.0 |
| Annual Precipitation Days | 72.6 |
| Average Annual Precipitation | 38.2 |
| Average Annual Snowfall | 34.2 |
Average High
Days of Rain
Source: NOAA climate normals (30-year)
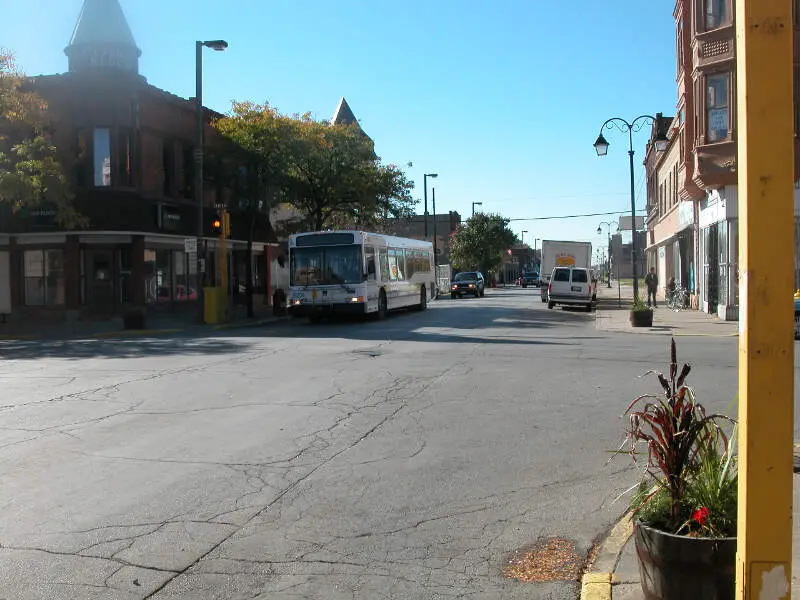
Harvey, IL Photos
Rankings & Articles For Harvey


Locations Around Harvey
Map Of Harvey, IL
Best Places Around Harvey
Hinsdale, IL
Population 17,175
Burr Ridge, IL
Population 11,141
Darien, IL
Population 21,879
La Grange, IL
Population 15,998
Western Springs, IL
Population 13,446
Tinley Park, IL
Population 54,842
Flossmoor, IL
Population 9,391
Palos Heights, IL
Population 12,152
Orland Park, IL
Population 57,916
Lemont, IL
Population 17,820
Harvey Demographics And Statistics
Population over time in Harvey
The current population in Harvey is 20,230. The population has decreased 20.6% from 2010.
| Year | Population | % Change |
|---|---|---|
| 2024 | 20,230 | 2.0% |
| 2023 | 19,831 | -1.0% |
| 2022 | 20,035 | -3.5% |
| 2021 | 20,751 | -14.6% |
| 2020 | 24,295 | -0.4% |
| 2019 | 24,386 | -0.9% |
| 2018 | 24,599 | -4.2% |
| 2017 | 25,685 | 0.2% |
| 2016 | 25,625 | -0.6% |
| 2015 | 25,773 | 2.2% |
| 2014 | 25,225 | 1.8% |
| 2013 | 24,771 | -0.8% |
| 2012 | 24,959 | -0.9% |
| 2011 | 25,189 | -1.2% |
| 2010 | 25,489 | - |
Race / Ethnicity in Harvey
See the full breakdown
Harvey is:
2.4% White with 486 White residents.
53.6% African American with 10,836 African American residents.
0.2% American Indian with 40 American Indian residents.
2.2% Asian with 455 Asian residents.
0.0% Hawaiian with 0 Hawaiian residents.
0.0% Other with 7 Other residents.
2.5% Two Or More with 505 Two Or More residents.
39.1% Hispanic with 7,901 Hispanic residents.
| Race | Harvey | IL | USA |
|---|---|---|---|
| White | 2.4% | 58.1% | 57.4% |
| African American | 53.6% | 13.3% | 11.9% |
| American Indian | 0.2% | 0.1% | 0.5% |
| Asian | 2.2% | 5.9% | 5.9% |
| Hawaiian | 0.0% | 0.0% | 0.2% |
| Other | 0.0% | 0.4% | 0.6% |
| Two Or More | 2.5% | 3.4% | 4.3% |
| Hispanic | 39.1% | 18.8% | 19.3% |
Gender in Harvey
See the full breakdown
Harvey is 50.8% female with 10,269 female residents.
Harvey is 49.2% male with 9,961 male residents.
| Gender | Harvey | IL | USA |
|---|---|---|---|
| Female | 50.8% | 50.6% | 50.5% |
| Male | 49.2% | 49.4% | 49.5% |
Highest level of educational attainment in Harvey for adults over 25
See the full breakdown
13.0% of adults in Harvey completed < 9th grade.
9.0% of adults in Harvey completed 9-12th grade.
38.0% of adults in Harvey completed high school / ged.
24.0% of adults in Harvey completed some college.
5.0% of adults in Harvey completed associate's degree.
9.0% of adults in Harvey completed bachelor's degree.
2.0% of adults in Harvey completed master's degree.
0.0% of adults in Harvey completed professional degree.
0.0% of adults in Harvey completed doctorate degree.
| Education | Harvey | IL | USA |
|---|---|---|---|
| < 9th Grade | 13.0% | 5.0% | 4.0% |
| 9-12th Grade | 9.0% | 5.0% | 6.0% |
| High School / GED | 38.0% | 25.0% | 26.0% |
| Some College | 24.0% | 19.0% | 19.0% |
| Associate's Degree | 5.0% | 8.0% | 9.0% |
| Bachelor's Degree | 9.0% | 23.0% | 22.0% |
| Master's Degree | 2.0% | 11.0% | 10.0% |
| Professional Degree | 0.0% | 2.0% | 2.0% |
| Doctorate Degree | 0.0% | 2.0% | 2.0% |
Household Income For Harvey, Illinois
See the full breakdown
17.4% of households in Harvey earn Less than $10,000.
5.7% of households in Harvey earn $10,000 to $14,999.
9.9% of households in Harvey earn $15,000 to $24,999.
10.1% of households in Harvey earn $25,000 to $34,999.
14.9% of households in Harvey earn $35,000 to $49,999.
7.9% of households in Harvey earn $50,000 to $74,999.
13.3% of households in Harvey earn $75,000 to $99,999.
11.1% of households in Harvey earn $100,000 to $149,999.
3.8% of households in Harvey earn $150,000 to $199,999.
5.9% of households in Harvey earn $200,000 or more.
| Income | Harvey | IL | USA |
|---|---|---|---|
| Less than $10,000 | 17.4% | 5.4% | 5.0% |
| $10,000 to $14,999 | 5.7% | 3.2% | 3.4% |
| $15,000 to $24,999 | 9.9% | 5.9% | 6.3% |
| $25,000 to $34,999 | 10.1% | 6.3% | 6.6% |
| $35,000 to $49,999 | 14.9% | 9.7% | 10.1% |
| $50,000 to $74,999 | 7.9% | 14.8% | 15.5% |
| $75,000 to $99,999 | 13.3% | 12.6% | 12.6% |
| $100,000 to $149,999 | 11.1% | 18.0% | 17.5% |
| $150,000 to $199,999 | 3.8% | 10.1% | 9.6% |
| $200,000 or more | 5.9% | 13.8% | 13.4% |
Source: U.S. Census ACS 5-year estimates (2024)


