Joliet SnackAbility
Overall SnackAbility
Crime in Joliet summary. We use data from the FBI to determine the crime rates in Joliet. Key points include:
There were 2,401 total crimes in Joliet in the last reporting year.
The overall crime rate per 100,000 people in Joliet is 1,594.6 / 100k people.
The violent crime rate per 100,000 people in Joliet is 350.0 / 100k people.
The property crime rate per 100,000 people in Joliet is 1,244.6 / 100k people.
Overall, crime in Joliet is -24.75% below the national average.
Total Crimes
Below National Average
Crime In Joliet Comparison Table
| Statistic | Count Raw |
Joliet / 100k People |
Illinois / 100k People |
National / 100k People |
|---|---|---|---|---|
| Total Crimes Per 100K | 2,401 | 1,594.6 | 2,004.4 | 2,119.2 |
| Violent Crime | 527 | 350.0 | 289.2 | 359.0 |
| Murder | 0 | 0.0 | 5.8 | 5.0 |
| Robbery | 53 | 35.2 | 90.2 | 61.0 |
| Aggravated Assault | 401 | 266.3 | 146.3 | 256.0 |
| Property Crime | 1,874 | 1,244.6 | 1,715.2 | 1,760.0 |
| Burglary | 587 | 389.9 | 290.5 | 229.0 |
| Larceny | 1,060 | 704.0 | 1,134.4 | 1,272.0 |
| Car Theft | 227 | 150.8 | 290.4 | 259.0 |
Source: FBI Uniform Crime Reporting (2024)
Cost of living in Joliet summary. We use data on the cost of living to determine how expensive it is to live in Joliet. Real estate prices drive most of the variance in cost of living around Illinois. Key points include:
The cost of living in Joliet is 101 with 100 being average.
The cost of living in Joliet is 1.0x higher than the national average.
The median home value in Joliet is $259,874.
The median income in Joliet is $92,201.
Joliet's Overall Cost Of Living
Higher Than The National Average
Cost Of Living In Joliet Comparison Table
| Living Expense | Joliet | Illinois | National Average |
|---|---|---|---|
| Overall | 101 | 98 | 100 |
| Services | 99 | 99 | 100 |
| Groceries | 99 | 99 | 100 |
| Health | 108 | 96 | 100 |
| Housing | 101 | 101 | 100 |
| Transportation | 100 | 99 | 100 |
| Utilities | 100 | 101 | 100 |
Source: Cost of living index, normalized to US average = 100
Joliet, IL Weather
The average high in Joliet is 59.8° and the average low is 39.8°.
There are 68.4 days of precipitation each year.
Expect an average of 37.4 inches of precipitation each year with 28.5 inches of snow.
| Stat | Joliet |
|---|---|
| Average Annual High | 59.8 |
| Average Annual Low | 39.8 |
| Annual Precipitation Days | 68.4 |
| Average Annual Precipitation | 37.4 |
| Average Annual Snowfall | 28.5 |
Average High
Days of Rain
Source: NOAA climate normals (30-year)
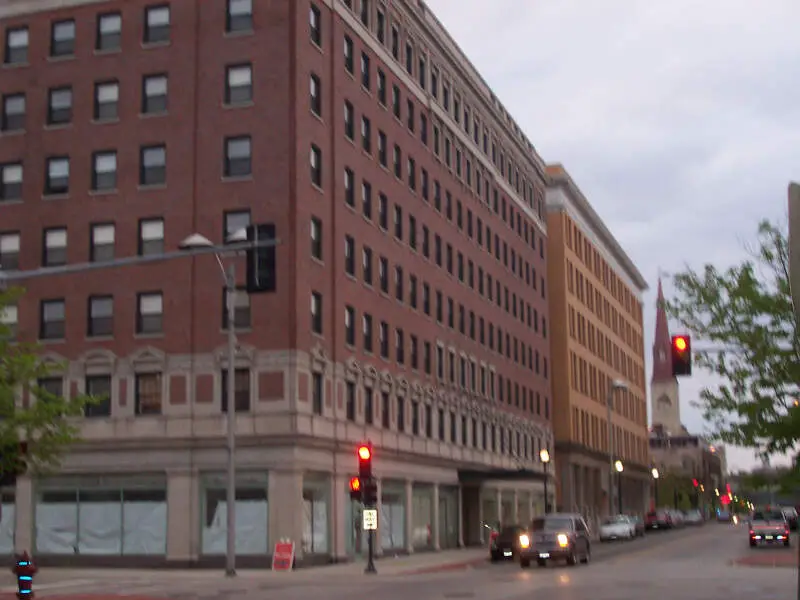
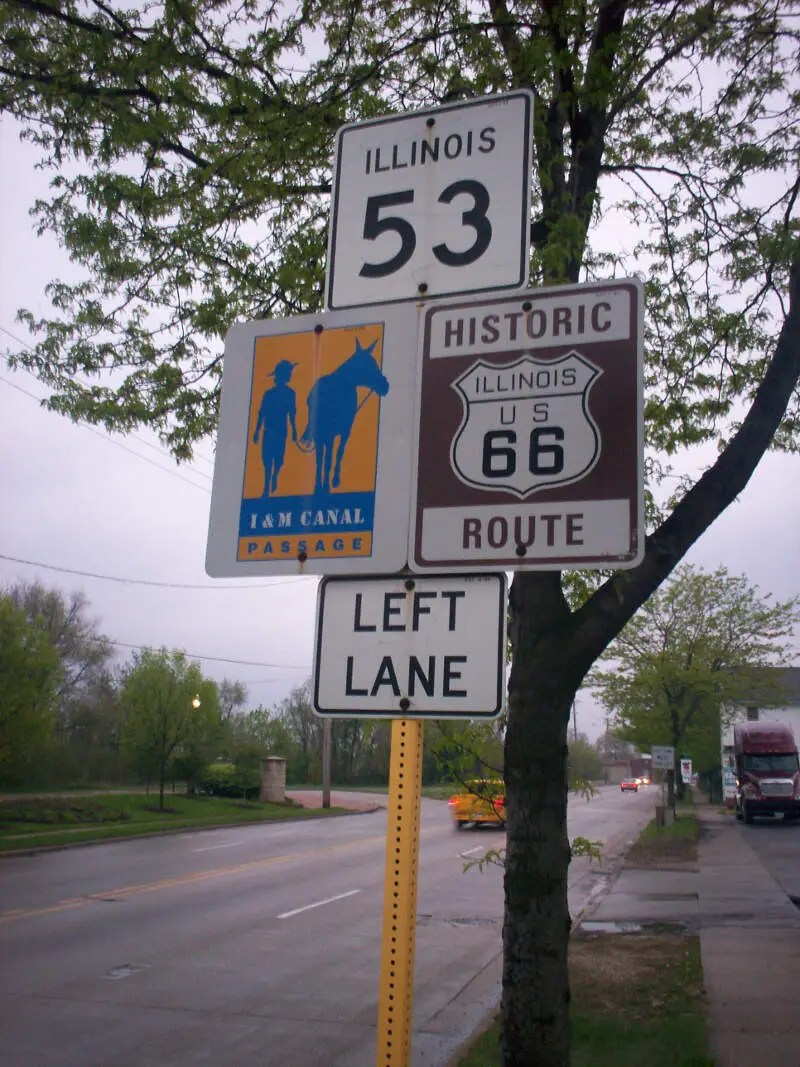
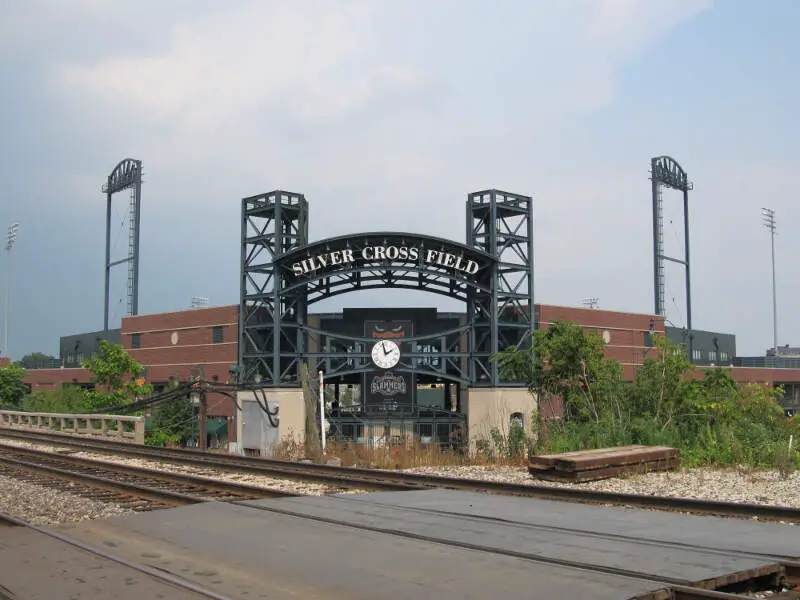
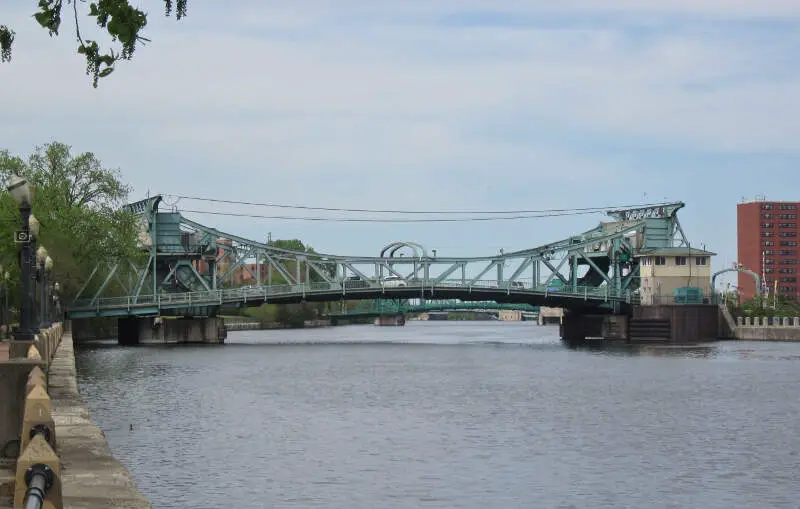
Joliet, IL Photos


Rankings & Articles For Joliet


Locations Around Joliet
Map Of Joliet, IL
Best Places Around Joliet
Burr Ridge, IL
Population 11,141
Naperville, IL
Population 150,692
Darien, IL
Population 21,879
Lisle, IL
Population 23,407
Tinley Park, IL
Population 54,842
Orland Park, IL
Population 57,916
Woodridge, IL
Population 33,941
Lemont, IL
Population 17,820
Plainfield, IL
Population 46,708
Boulder Hill, IL
Population 8,989
Joliet Demographics And Statistics
Population over time in Joliet
The current population in Joliet is 150,445. The population has increased 3.8% from 2010.
| Year | Population | % Change |
|---|---|---|
| 2024 | 150,445 | 0.4% |
| 2023 | 149,785 | -0.3% |
| 2022 | 150,221 | -0.1% |
| 2021 | 150,323 | 2.0% |
| 2020 | 147,323 | -0.3% |
| 2019 | 147,826 | -0.1% |
| 2018 | 147,957 | -0.1% |
| 2017 | 148,172 | 0.4% |
| 2016 | 147,515 | -0.3% |
| 2015 | 147,918 | 0.1% |
| 2014 | 147,786 | 0.2% |
| 2013 | 147,459 | 0.2% |
| 2012 | 147,098 | 0.2% |
| 2011 | 146,820 | 1.3% |
| 2010 | 145,002 | - |
Race / Ethnicity in Joliet
See the full breakdown
Joliet is:
44.0% White with 66,250 White residents.
16.0% African American with 24,069 African American residents.
0.0% American Indian with 47 American Indian residents.
2.4% Asian with 3,539 Asian residents.
0.0% Hawaiian with 1 Hawaiian residents.
0.2% Other with 373 Other residents.
3.1% Two Or More with 4,731 Two Or More residents.
34.2% Hispanic with 51,435 Hispanic residents.
| Race | Joliet | IL | USA |
|---|---|---|---|
| White | 44.0% | 58.1% | 57.4% |
| African American | 16.0% | 13.3% | 11.9% |
| American Indian | 0.0% | 0.1% | 0.5% |
| Asian | 2.4% | 5.9% | 5.9% |
| Hawaiian | 0.0% | 0.0% | 0.2% |
| Other | 0.2% | 0.4% | 0.6% |
| Two Or More | 3.1% | 3.4% | 4.3% |
| Hispanic | 34.2% | 18.8% | 19.3% |
Gender in Joliet
See the full breakdown
Joliet is 49.6% female with 74,661 female residents.
Joliet is 50.4% male with 75,784 male residents.
| Gender | Joliet | IL | USA |
|---|---|---|---|
| Female | 49.6% | 50.6% | 50.5% |
| Male | 50.4% | 49.4% | 49.5% |
Highest level of educational attainment in Joliet for adults over 25
See the full breakdown
7.0% of adults in Joliet completed < 9th grade.
7.0% of adults in Joliet completed 9-12th grade.
29.0% of adults in Joliet completed high school / ged.
22.0% of adults in Joliet completed some college.
9.0% of adults in Joliet completed associate's degree.
16.0% of adults in Joliet completed bachelor's degree.
8.0% of adults in Joliet completed master's degree.
1.0% of adults in Joliet completed professional degree.
1.0% of adults in Joliet completed doctorate degree.
| Education | Joliet | IL | USA |
|---|---|---|---|
| < 9th Grade | 7.0% | 5.0% | 4.0% |
| 9-12th Grade | 7.0% | 5.0% | 6.0% |
| High School / GED | 29.0% | 25.0% | 26.0% |
| Some College | 22.0% | 19.0% | 19.0% |
| Associate's Degree | 9.0% | 8.0% | 9.0% |
| Bachelor's Degree | 16.0% | 23.0% | 22.0% |
| Master's Degree | 8.0% | 11.0% | 10.0% |
| Professional Degree | 1.0% | 2.0% | 2.0% |
| Doctorate Degree | 1.0% | 2.0% | 2.0% |
Household Income For Joliet, Illinois
See the full breakdown
5.5% of households in Joliet earn Less than $10,000.
2.8% of households in Joliet earn $10,000 to $14,999.
5.0% of households in Joliet earn $15,000 to $24,999.
5.1% of households in Joliet earn $25,000 to $34,999.
8.1% of households in Joliet earn $35,000 to $49,999.
14.6% of households in Joliet earn $50,000 to $74,999.
13.3% of households in Joliet earn $75,000 to $99,999.
21.6% of households in Joliet earn $100,000 to $149,999.
14.0% of households in Joliet earn $150,000 to $199,999.
10.0% of households in Joliet earn $200,000 or more.
| Income | Joliet | IL | USA |
|---|---|---|---|
| Less than $10,000 | 5.5% | 5.4% | 5.0% |
| $10,000 to $14,999 | 2.8% | 3.2% | 3.4% |
| $15,000 to $24,999 | 5.0% | 5.9% | 6.3% |
| $25,000 to $34,999 | 5.1% | 6.3% | 6.6% |
| $35,000 to $49,999 | 8.1% | 9.7% | 10.1% |
| $50,000 to $74,999 | 14.6% | 14.8% | 15.5% |
| $75,000 to $99,999 | 13.3% | 12.6% | 12.6% |
| $100,000 to $149,999 | 21.6% | 18.0% | 17.5% |
| $150,000 to $199,999 | 14.0% | 10.1% | 9.6% |
| $200,000 or more | 10.0% | 13.8% | 13.4% |
Source: U.S. Census ACS 5-year estimates (2024)


