Lincolnshire SnackAbility
Overall SnackAbility
Crime in Lincolnshire summary. We use data from the FBI to determine the crime rates in Lincolnshire. Key points include:
There were 76 total crimes in Lincolnshire in the last reporting year.
The overall crime rate per 100,000 people in Lincolnshire is 961.9 / 100k people.
The violent crime rate per 100,000 people in Lincolnshire is 63.3 / 100k people.
The property crime rate per 100,000 people in Lincolnshire is 898.6 / 100k people.
Overall, crime in Lincolnshire is -54.61% below the national average.
Total Crimes
Below National Average
Crime In Lincolnshire Comparison Table
| Statistic | Count Raw |
Lincolnshire / 100k People |
Illinois / 100k People |
National / 100k People |
|---|---|---|---|---|
| Total Crimes Per 100K | 76 | 961.9 | 2,004.4 | 2,119.2 |
| Violent Crime | 5 | 63.3 | 289.2 | 359.0 |
| Murder | 0 | 0.0 | 5.8 | 5.0 |
| Robbery | 0 | 0.0 | 90.2 | 61.0 |
| Aggravated Assault | 4 | 50.6 | 146.3 | 256.0 |
| Property Crime | 71 | 898.6 | 1,715.2 | 1,760.0 |
| Burglary | 8 | 101.3 | 290.5 | 229.0 |
| Larceny | 60 | 759.4 | 1,134.4 | 1,272.0 |
| Car Theft | 3 | 38.0 | 290.4 | 259.0 |
Source: FBI Uniform Crime Reporting (2024)
Cost of living in Lincolnshire summary. We use data on the cost of living to determine how expensive it is to live in Lincolnshire. Real estate prices drive most of the variance in cost of living around Illinois. Key points include:
The cost of living in Lincolnshire is 161 with 100 being average.
The cost of living in Lincolnshire is 1.6x higher than the national average.
The median home value in Lincolnshire is $714,055.
The median income in Lincolnshire is $185,580.
Lincolnshire's Overall Cost Of Living
Higher Than The National Average
Cost Of Living In Lincolnshire Comparison Table
| Living Expense | Lincolnshire | Illinois | National Average |
|---|---|---|---|
| Overall | 161 | 98 | 100 |
| Services | 98 | 99 | 100 |
| Groceries | 98 | 99 | 100 |
| Health | 300 | 96 | 100 |
| Housing | 105 | 101 | 100 |
| Transportation | 101 | 99 | 100 |
| Utilities | 104 | 101 | 100 |
Source: Cost of living index, normalized to US average = 100
Lincolnshire, IL Weather
The average high in Lincolnshire is 57.3° and the average low is 39.5°.
There are 68.7 days of precipitation each year.
Expect an average of 36.1 inches of precipitation each year with 39.5 inches of snow.
| Stat | Lincolnshire |
|---|---|
| Average Annual High | 57.3 |
| Average Annual Low | 39.5 |
| Annual Precipitation Days | 68.7 |
| Average Annual Precipitation | 36.1 |
| Average Annual Snowfall | 39.5 |
Average High
Days of Rain
Source: NOAA climate normals (30-year)
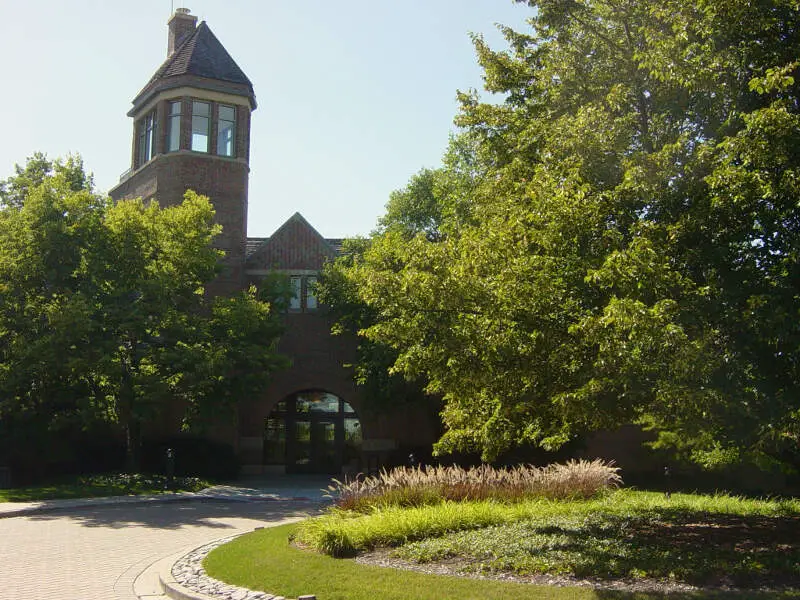
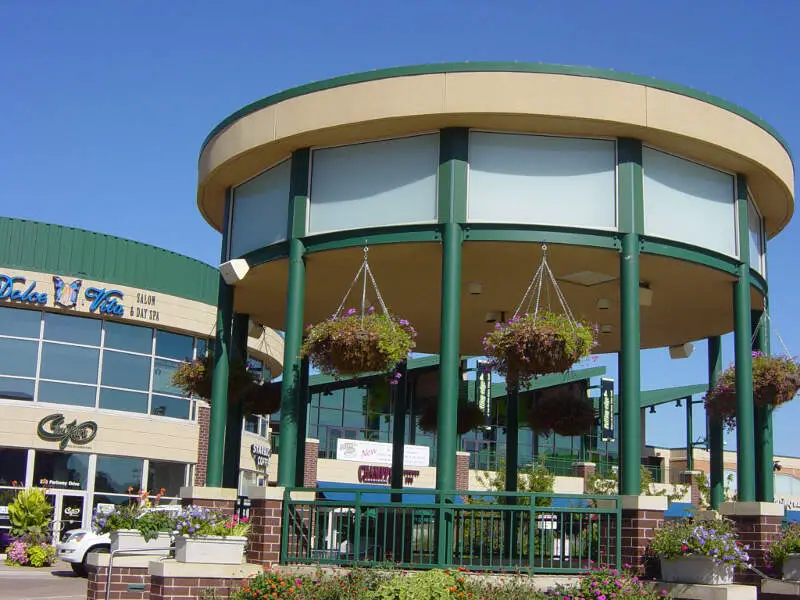
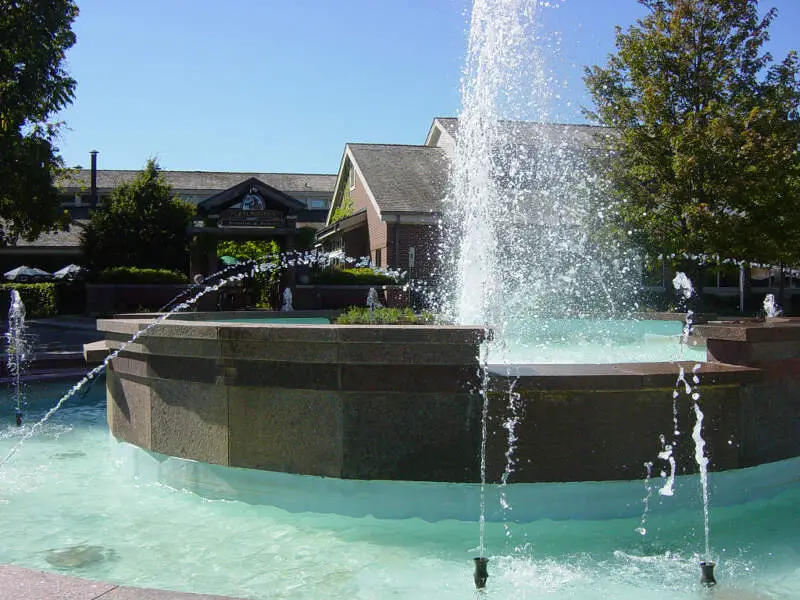
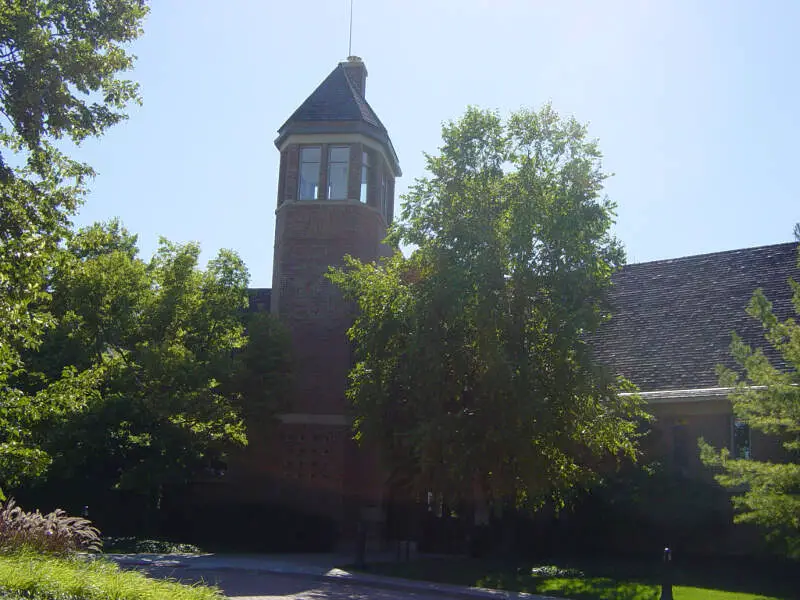
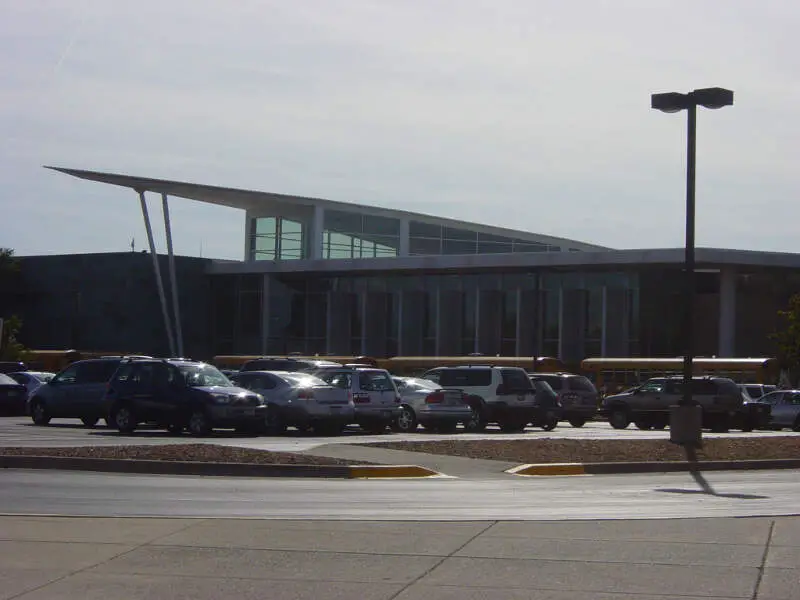
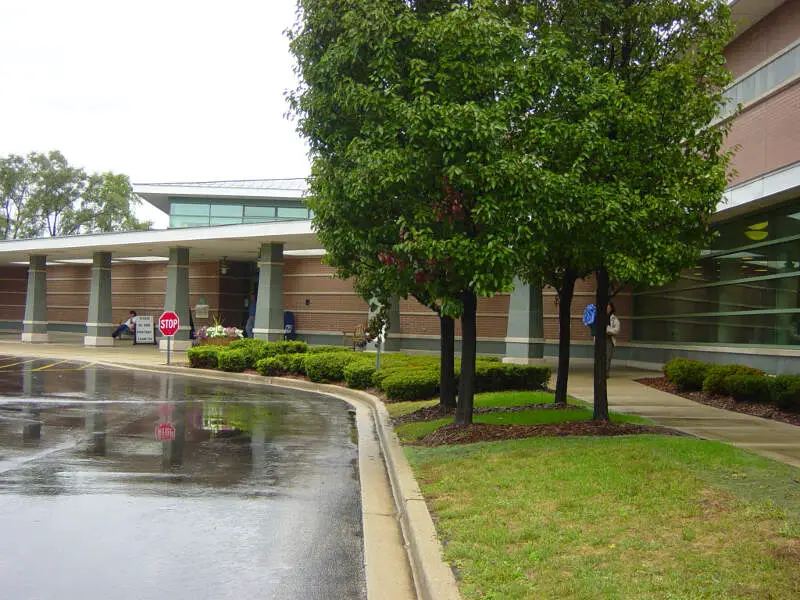
Lincolnshire, IL Photos
Rankings & Articles For Lincolnshire


Locations Around Lincolnshire
Map Of Lincolnshire, IL
Best Places Around Lincolnshire
Wilmette, IL
Population 27,503
Highland Park, IL
Population 30,398
Buffalo Grove, IL
Population 42,891
Deerfield, IL
Population 19,518
Northbrook, IL
Population 34,585
Glenview, IL
Population 47,752
Park Ridge, IL
Population 38,667
Lake Bluff, IL
Population 6,041
Lake Zurich, IL
Population 19,832
Arlington Heights, IL
Population 76,005
Lincolnshire Demographics And Statistics
Population over time in Lincolnshire
The current population in Lincolnshire is 7,980. The population has increased 12.8% from 2010.
| Year | Population | % Change |
|---|---|---|
| 2024 | 7,980 | 0.5% |
| 2023 | 7,937 | 0.4% |
| 2022 | 7,907 | 0.0% |
| 2021 | 7,905 | 2.7% |
| 2020 | 7,694 | 1.6% |
| 2019 | 7,572 | 1.4% |
| 2018 | 7,469 | 1.9% |
| 2017 | 7,328 | 0.5% |
| 2016 | 7,291 | 0.3% |
| 2015 | 7,271 | 0.0% |
| 2014 | 7,270 | 0.2% |
| 2013 | 7,254 | 0.4% |
| 2012 | 7,228 | 0.5% |
| 2011 | 7,192 | 1.6% |
| 2010 | 7,077 | - |
Race / Ethnicity in Lincolnshire
See the full breakdown
Lincolnshire is:
69.3% White with 5,528 White residents.
1.4% African American with 111 African American residents.
0.0% American Indian with 0 American Indian residents.
24.0% Asian with 1,915 Asian residents.
0.0% Hawaiian with 0 Hawaiian residents.
1.1% Other with 85 Other residents.
2.7% Two Or More with 215 Two Or More residents.
1.6% Hispanic with 126 Hispanic residents.
| Race | Lincolnshire | IL | USA |
|---|---|---|---|
| White | 69.3% | 58.1% | 57.4% |
| African American | 1.4% | 13.3% | 11.9% |
| American Indian | 0.0% | 0.1% | 0.5% |
| Asian | 24.0% | 5.9% | 5.9% |
| Hawaiian | 0.0% | 0.0% | 0.2% |
| Other | 1.1% | 0.4% | 0.6% |
| Two Or More | 2.7% | 3.4% | 4.3% |
| Hispanic | 1.6% | 18.8% | 19.3% |
Gender in Lincolnshire
See the full breakdown
Lincolnshire is 51.7% female with 4,128 female residents.
Lincolnshire is 48.3% male with 3,851 male residents.
| Gender | Lincolnshire | IL | USA |
|---|---|---|---|
| Female | 51.7% | 50.6% | 50.5% |
| Male | 48.3% | 49.4% | 49.5% |
Highest level of educational attainment in Lincolnshire for adults over 25
See the full breakdown
2.0% of adults in Lincolnshire completed < 9th grade.
1.0% of adults in Lincolnshire completed 9-12th grade.
10.0% of adults in Lincolnshire completed high school / ged.
7.0% of adults in Lincolnshire completed some college.
3.0% of adults in Lincolnshire completed associate's degree.
36.0% of adults in Lincolnshire completed bachelor's degree.
27.0% of adults in Lincolnshire completed master's degree.
7.0% of adults in Lincolnshire completed professional degree.
7.0% of adults in Lincolnshire completed doctorate degree.
| Education | Lincolnshire | IL | USA |
|---|---|---|---|
| < 9th Grade | 2.0% | 5.0% | 4.0% |
| 9-12th Grade | 1.0% | 5.0% | 6.0% |
| High School / GED | 10.0% | 25.0% | 26.0% |
| Some College | 7.0% | 19.0% | 19.0% |
| Associate's Degree | 3.0% | 8.0% | 9.0% |
| Bachelor's Degree | 36.0% | 23.0% | 22.0% |
| Master's Degree | 27.0% | 11.0% | 10.0% |
| Professional Degree | 7.0% | 2.0% | 2.0% |
| Doctorate Degree | 7.0% | 2.0% | 2.0% |
Household Income For Lincolnshire, Illinois
See the full breakdown
3.7% of households in Lincolnshire earn Less than $10,000.
1.1% of households in Lincolnshire earn $10,000 to $14,999.
3.4% of households in Lincolnshire earn $15,000 to $24,999.
2.0% of households in Lincolnshire earn $25,000 to $34,999.
5.7% of households in Lincolnshire earn $35,000 to $49,999.
6.1% of households in Lincolnshire earn $50,000 to $74,999.
4.4% of households in Lincolnshire earn $75,000 to $99,999.
12.1% of households in Lincolnshire earn $100,000 to $149,999.
14.4% of households in Lincolnshire earn $150,000 to $199,999.
47.0% of households in Lincolnshire earn $200,000 or more.
| Income | Lincolnshire | IL | USA |
|---|---|---|---|
| Less than $10,000 | 3.7% | 5.4% | 5.0% |
| $10,000 to $14,999 | 1.1% | 3.2% | 3.4% |
| $15,000 to $24,999 | 3.4% | 5.9% | 6.3% |
| $25,000 to $34,999 | 2.0% | 6.3% | 6.6% |
| $35,000 to $49,999 | 5.7% | 9.7% | 10.1% |
| $50,000 to $74,999 | 6.1% | 14.8% | 15.5% |
| $75,000 to $99,999 | 4.4% | 12.6% | 12.6% |
| $100,000 to $149,999 | 12.1% | 18.0% | 17.5% |
| $150,000 to $199,999 | 14.4% | 10.1% | 9.6% |
| $200,000 or more | 47.0% | 13.8% | 13.4% |
Source: U.S. Census ACS 5-year estimates (2024)


