Peoria SnackAbility
Overall SnackAbility
Crime in Peoria summary. We use data from the FBI to determine the crime rates in Peoria. Key points include:
There were 6,174 total crimes in Peoria in the last reporting year.
The overall crime rate per 100,000 people in Peoria is 5,629.3 / 100k people.
The violent crime rate per 100,000 people in Peoria is 1,344.9 / 100k people.
The property crime rate per 100,000 people in Peoria is 4,284.4 / 100k people.
Overall, crime in Peoria is 165.63% above the national average.
Total Crimes
Above National Average
Crime In Peoria Comparison Table
| Statistic | Count Raw |
Peoria / 100k People |
Illinois / 100k People |
National / 100k People |
|---|---|---|---|---|
| Total Crimes Per 100K | 6,174 | 5,629.3 | 2,004.4 | 2,119.2 |
| Violent Crime | 1,475 | 1,344.9 | 289.2 | 359.0 |
| Murder | 14 | 12.8 | 5.8 | 5.0 |
| Robbery | 140 | 127.6 | 90.2 | 61.0 |
| Aggravated Assault | 1,154 | 1,052.2 | 146.3 | 256.0 |
| Property Crime | 4,699 | 4,284.4 | 1,715.2 | 1,760.0 |
| Burglary | 1,581 | 1,441.5 | 290.5 | 229.0 |
| Larceny | 2,266 | 2,066.1 | 1,134.4 | 1,272.0 |
| Car Theft | 852 | 776.8 | 290.4 | 259.0 |
Source: FBI Uniform Crime Reporting (2024)
Cost of living in Peoria summary. We use data on the cost of living to determine how expensive it is to live in Peoria. Real estate prices drive most of the variance in cost of living around Illinois. Key points include:
The cost of living in Peoria is 92 with 100 being average.
The cost of living in Peoria is 0.9x lower than the national average.
The median home value in Peoria is $128,837.
The median income in Peoria is $59,410.
Peoria's Overall Cost Of Living
Lower Than The National Average
Cost Of Living In Peoria Comparison Table
| Living Expense | Peoria | Illinois | National Average |
|---|---|---|---|
| Overall | 92 | 98 | 100 |
| Services | 96 | 99 | 100 |
| Groceries | 102 | 99 | 100 |
| Health | 77 | 96 | 100 |
| Housing | 99 | 101 | 100 |
| Transportation | 101 | 99 | 100 |
| Utilities | 100 | 101 | 100 |
Source: Cost of living index, normalized to US average = 100
Peoria, IL Weather
The average high in Peoria is 61.4° and the average low is 41.4°.
There are 70.1 days of precipitation each year.
Expect an average of 36.4 inches of precipitation each year with 23.2 inches of snow.
| Stat | Peoria |
|---|---|
| Average Annual High | 61.4 |
| Average Annual Low | 41.4 |
| Annual Precipitation Days | 70.1 |
| Average Annual Precipitation | 36.4 |
| Average Annual Snowfall | 23.2 |
Average High
Days of Rain
Source: NOAA climate normals (30-year)
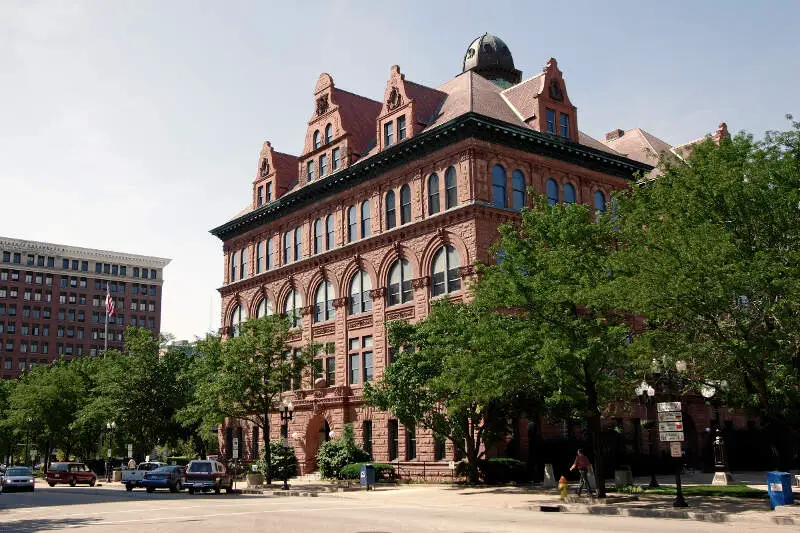
Peoria, IL Photos


Rankings & Articles For Peoria


Locations Around Peoria
Map Of Peoria, IL
Best Places Around Peoria
Morton, IL
Population 16,595
Washington, IL
Population 15,919
Eureka, IL
Population 5,007
Chillicothe, IL
Population 5,900
East Peoria, IL
Population 22,324
Bartonville, IL
Population 5,841
Peoria Heights, IL
Population 5,825
Pekin, IL
Population 31,781
Peoria Demographics And Statistics
Population over time in Peoria
The current population in Peoria is 112,169. The population has decreased 1.5% from 2010.
| Year | Population | % Change |
|---|---|---|
| 2024 | 112,169 | 0.0% |
| 2023 | 112,126 | -0.8% |
| 2022 | 113,054 | -0.5% |
| 2021 | 113,672 | 0.9% |
| 2020 | 112,644 | -0.8% |
| 2019 | 113,532 | -0.9% |
| 2018 | 114,512 | -0.8% |
| 2017 | 115,424 | -0.5% |
| 2016 | 115,990 | 0.1% |
| 2015 | 115,847 | 0.1% |
| 2014 | 115,718 | 0.2% |
| 2013 | 115,466 | 0.6% |
| 2012 | 114,754 | 0.4% |
| 2011 | 114,315 | 0.4% |
| 2010 | 113,853 | - |
Race / Ethnicity in Peoria
See the full breakdown
Peoria is:
53.2% White with 59,620 White residents.
25.6% African American with 28,760 African American residents.
0.0% American Indian with 38 American Indian residents.
6.6% Asian with 7,398 Asian residents.
0.0% Hawaiian with 25 Hawaiian residents.
0.5% Other with 610 Other residents.
6.1% Two Or More with 6,788 Two Or More residents.
8.0% Hispanic with 8,930 Hispanic residents.
| Race | Peoria | IL | USA |
|---|---|---|---|
| White | 53.2% | 58.1% | 57.4% |
| African American | 25.6% | 13.3% | 11.9% |
| American Indian | 0.0% | 0.1% | 0.5% |
| Asian | 6.6% | 5.9% | 5.9% |
| Hawaiian | 0.0% | 0.0% | 0.2% |
| Other | 0.5% | 0.4% | 0.6% |
| Two Or More | 6.1% | 3.4% | 4.3% |
| Hispanic | 8.0% | 18.8% | 19.3% |
Gender in Peoria
See the full breakdown
Peoria is 52.1% female with 58,391 female residents.
Peoria is 47.9% male with 53,778 male residents.
| Gender | Peoria | IL | USA |
|---|---|---|---|
| Female | 52.1% | 50.6% | 50.5% |
| Male | 47.9% | 49.4% | 49.5% |
Highest level of educational attainment in Peoria for adults over 25
See the full breakdown
3.0% of adults in Peoria completed < 9th grade.
5.0% of adults in Peoria completed 9-12th grade.
26.0% of adults in Peoria completed high school / ged.
20.0% of adults in Peoria completed some college.
9.0% of adults in Peoria completed associate's degree.
22.0% of adults in Peoria completed bachelor's degree.
11.0% of adults in Peoria completed master's degree.
2.0% of adults in Peoria completed professional degree.
2.0% of adults in Peoria completed doctorate degree.
| Education | Peoria | IL | USA |
|---|---|---|---|
| < 9th Grade | 3.0% | 5.0% | 4.0% |
| 9-12th Grade | 5.0% | 5.0% | 6.0% |
| High School / GED | 26.0% | 25.0% | 26.0% |
| Some College | 20.0% | 19.0% | 19.0% |
| Associate's Degree | 9.0% | 8.0% | 9.0% |
| Bachelor's Degree | 22.0% | 23.0% | 22.0% |
| Master's Degree | 11.0% | 11.0% | 10.0% |
| Professional Degree | 2.0% | 2.0% | 2.0% |
| Doctorate Degree | 2.0% | 2.0% | 2.0% |
Household Income For Peoria, Illinois
See the full breakdown
9.3% of households in Peoria earn Less than $10,000.
6.0% of households in Peoria earn $10,000 to $14,999.
9.1% of households in Peoria earn $15,000 to $24,999.
7.7% of households in Peoria earn $25,000 to $34,999.
11.8% of households in Peoria earn $35,000 to $49,999.
16.9% of households in Peoria earn $50,000 to $74,999.
11.3% of households in Peoria earn $75,000 to $99,999.
12.1% of households in Peoria earn $100,000 to $149,999.
6.9% of households in Peoria earn $150,000 to $199,999.
9.0% of households in Peoria earn $200,000 or more.
| Income | Peoria | IL | USA |
|---|---|---|---|
| Less than $10,000 | 9.3% | 5.4% | 5.0% |
| $10,000 to $14,999 | 6.0% | 3.2% | 3.4% |
| $15,000 to $24,999 | 9.1% | 5.9% | 6.3% |
| $25,000 to $34,999 | 7.7% | 6.3% | 6.6% |
| $35,000 to $49,999 | 11.8% | 9.7% | 10.1% |
| $50,000 to $74,999 | 16.9% | 14.8% | 15.5% |
| $75,000 to $99,999 | 11.3% | 12.6% | 12.6% |
| $100,000 to $149,999 | 12.1% | 18.0% | 17.5% |
| $150,000 to $199,999 | 6.9% | 10.1% | 9.6% |
| $200,000 or more | 9.0% | 13.8% | 13.4% |
Source: U.S. Census ACS 5-year estimates (2024)


