Springfield SnackAbility
Overall SnackAbility
Crime in Springfield summary. We use data from the FBI to determine the crime rates in Springfield. Key points include:
There were 6,508 total crimes in Springfield in the last reporting year.
The overall crime rate per 100,000 people in Springfield is 5,812.5 / 100k people.
The violent crime rate per 100,000 people in Springfield is 901.2 / 100k people.
The property crime rate per 100,000 people in Springfield is 4,911.4 / 100k people.
Overall, crime in Springfield is 174.28% above the national average.
Total Crimes
Above National Average
Crime In Springfield Comparison Table
| Statistic | Count Raw |
Springfield / 100k People |
Illinois / 100k People |
National / 100k People |
|---|---|---|---|---|
| Total Crimes Per 100K | 6,508 | 5,812.5 | 2,004.4 | 2,119.2 |
| Violent Crime | 1,009 | 901.2 | 289.2 | 359.0 |
| Murder | 9 | 8.0 | 5.8 | 5.0 |
| Robbery | 150 | 134.0 | 90.2 | 61.0 |
| Aggravated Assault | 731 | 652.9 | 146.3 | 256.0 |
| Property Crime | 5,499 | 4,911.4 | 1,715.2 | 1,760.0 |
| Burglary | 1,707 | 1,524.6 | 290.5 | 229.0 |
| Larceny | 3,150 | 2,813.4 | 1,134.4 | 1,272.0 |
| Car Theft | 642 | 573.4 | 290.4 | 259.0 |
Source: FBI Uniform Crime Reporting (2024)
Cost of living in Springfield summary. We use data on the cost of living to determine how expensive it is to live in Springfield. Real estate prices drive most of the variance in cost of living around Illinois. Key points include:
The cost of living in Springfield is 93 with 100 being average.
The cost of living in Springfield is 0.9x lower than the national average.
The median home value in Springfield is $163,198.
The median income in Springfield is $66,064.
Springfield's Overall Cost Of Living
Lower Than The National Average
Cost Of Living In Springfield Comparison Table
| Living Expense | Springfield | Illinois | National Average |
|---|---|---|---|
| Overall | 93 | 98 | 100 |
| Services | 99 | 99 | 100 |
| Groceries | 101 | 99 | 100 |
| Health | 78 | 96 | 100 |
| Housing | 104 | 101 | 100 |
| Transportation | 101 | 99 | 100 |
| Utilities | 100 | 101 | 100 |
Source: Cost of living index, normalized to US average = 100
Springfield, IL Weather
The average high in Springfield is 63.0° and the average low is 42.6°.
There are 68.3 days of precipitation each year.
Expect an average of 36.9 inches of precipitation each year with 19.1 inches of snow.
| Stat | Springfield |
|---|---|
| Average Annual High | 63.0 |
| Average Annual Low | 42.6 |
| Annual Precipitation Days | 68.3 |
| Average Annual Precipitation | 36.9 |
| Average Annual Snowfall | 19.1 |
Average High
Days of Rain
Source: NOAA climate normals (30-year)
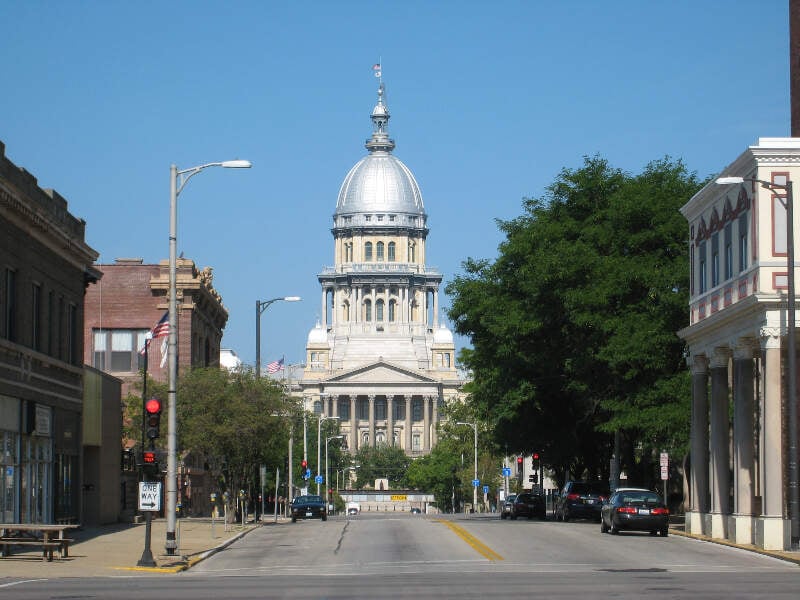
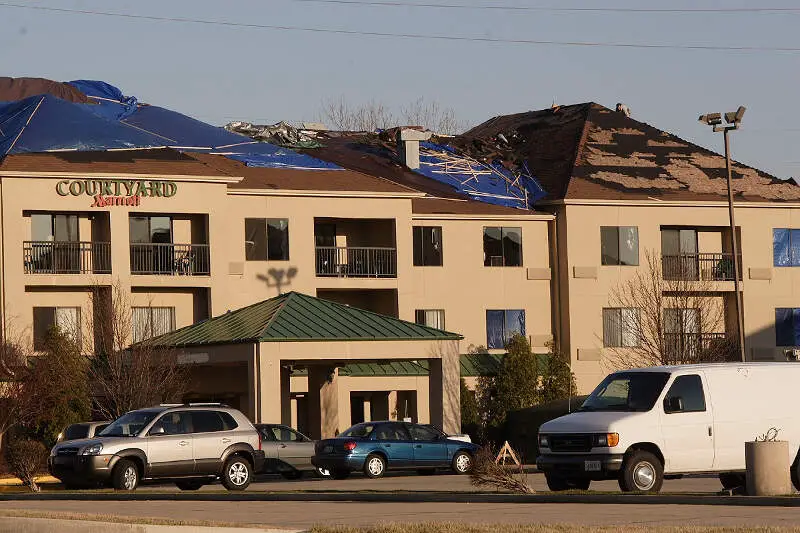
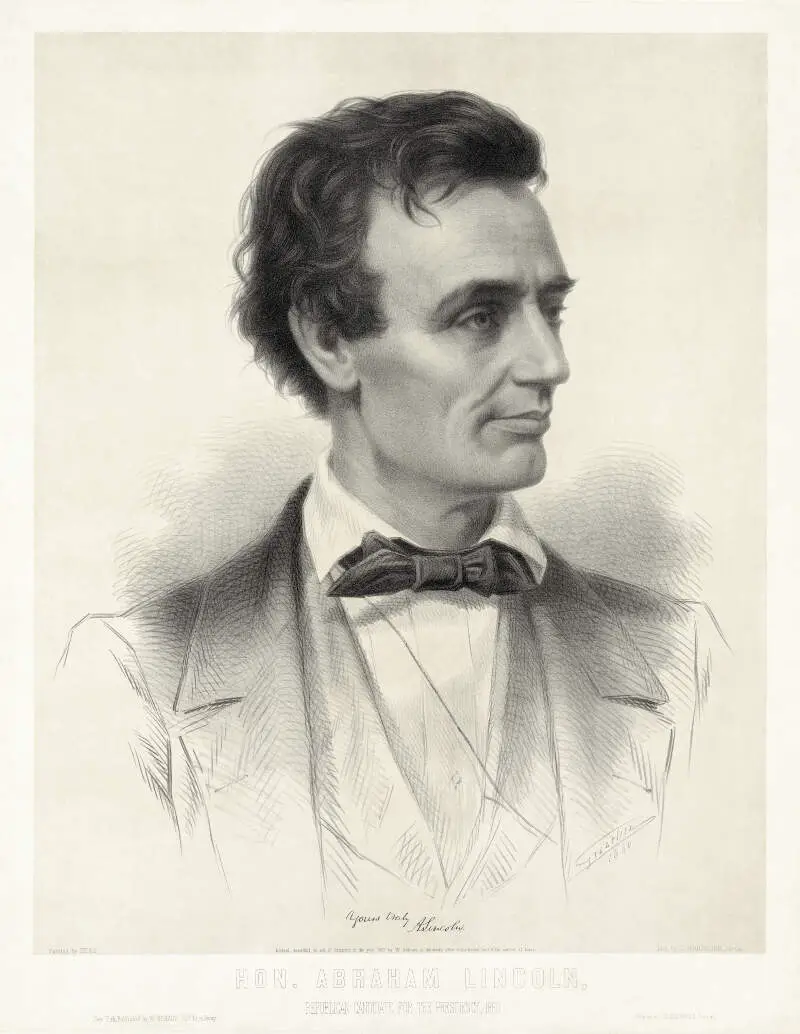
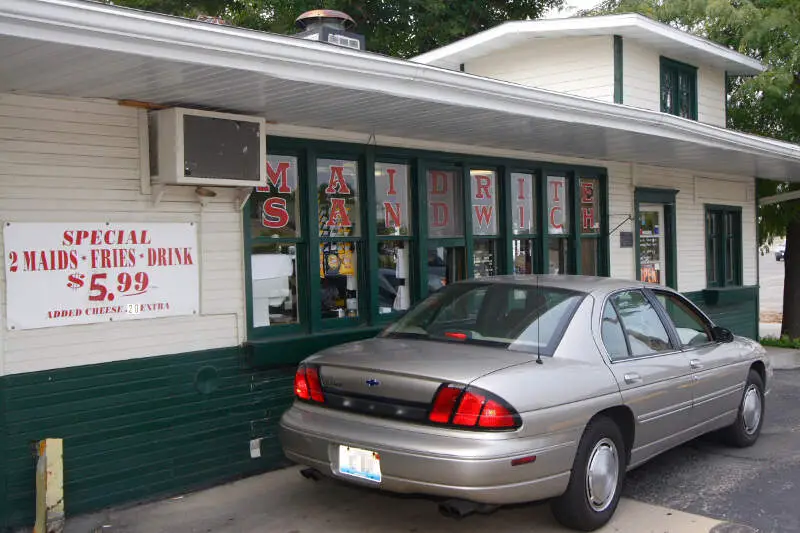
Springfield, IL Photos


Rankings & Articles For Springfield


Locations Around Springfield
Map Of Springfield, IL
Best Places Around Springfield
Chatham, IL
Population 14,639
Mount Zion, IL
Population 5,660
Wilmington, IL
Population 92
Lincoln, IL
Population 13,281
Jacksonville, IL
Population 18,014
Clinton, IL
Population 6,985
Carlinville, IL
Population 5,480
Middletown, KY
Population 9,763
Pana, IL
Population 5,217
Beardstown, IL
Population 6,169
Springfield Demographics And Statistics
Population over time in Springfield
The current population in Springfield is 113,330. The population has decreased 1.6% from 2010.
| Year | Population | % Change |
|---|---|---|
| 2024 | 113,330 | -0.3% |
| 2023 | 113,714 | -0.4% |
| 2022 | 114,214 | -0.4% |
| 2021 | 114,672 | -0.4% |
| 2020 | 115,075 | -0.7% |
| 2019 | 115,888 | -0.5% |
| 2018 | 116,459 | 0.1% |
| 2017 | 116,313 | -0.4% |
| 2016 | 116,745 | -0.3% |
| 2015 | 117,061 | 0.2% |
| 2014 | 116,815 | 0.3% |
| 2013 | 116,495 | 0.4% |
| 2012 | 115,982 | 0.3% |
| 2011 | 115,658 | 0.5% |
| 2010 | 115,121 | - |
Race / Ethnicity in Springfield
See the full breakdown
Springfield is:
69.3% White with 78,499 White residents.
19.1% African American with 21,697 African American residents.
0.1% American Indian with 79 American Indian residents.
3.0% Asian with 3,434 Asian residents.
0.0% Hawaiian with 15 Hawaiian residents.
0.8% Other with 879 Other residents.
4.3% Two Or More with 4,923 Two Or More residents.
3.4% Hispanic with 3,804 Hispanic residents.
| Race | Springfield | IL | USA |
|---|---|---|---|
| White | 69.3% | 58.1% | 57.4% |
| African American | 19.1% | 13.3% | 11.9% |
| American Indian | 0.1% | 0.1% | 0.5% |
| Asian | 3.0% | 5.9% | 5.9% |
| Hawaiian | 0.0% | 0.0% | 0.2% |
| Other | 0.8% | 0.4% | 0.6% |
| Two Or More | 4.3% | 3.4% | 4.3% |
| Hispanic | 3.4% | 18.8% | 19.3% |
Gender in Springfield
See the full breakdown
Springfield is 51.7% female with 58,552 female residents.
Springfield is 48.3% male with 54,777 male residents.
| Gender | Springfield | IL | USA |
|---|---|---|---|
| Female | 51.7% | 50.6% | 50.5% |
| Male | 48.3% | 49.4% | 49.5% |
Highest level of educational attainment in Springfield for adults over 25
See the full breakdown
2.0% of adults in Springfield completed < 9th grade.
5.0% of adults in Springfield completed 9-12th grade.
28.0% of adults in Springfield completed high school / ged.
20.0% of adults in Springfield completed some college.
9.0% of adults in Springfield completed associate's degree.
21.0% of adults in Springfield completed bachelor's degree.
11.0% of adults in Springfield completed master's degree.
3.0% of adults in Springfield completed professional degree.
1.0% of adults in Springfield completed doctorate degree.
| Education | Springfield | IL | USA |
|---|---|---|---|
| < 9th Grade | 2.0% | 5.0% | 4.0% |
| 9-12th Grade | 5.0% | 5.0% | 6.0% |
| High School / GED | 28.0% | 25.0% | 26.0% |
| Some College | 20.0% | 19.0% | 19.0% |
| Associate's Degree | 9.0% | 8.0% | 9.0% |
| Bachelor's Degree | 21.0% | 23.0% | 22.0% |
| Master's Degree | 11.0% | 11.0% | 10.0% |
| Professional Degree | 3.0% | 2.0% | 2.0% |
| Doctorate Degree | 1.0% | 2.0% | 2.0% |
Household Income For Springfield, Illinois
See the full breakdown
8.0% of households in Springfield earn Less than $10,000.
4.6% of households in Springfield earn $10,000 to $14,999.
7.4% of households in Springfield earn $15,000 to $24,999.
7.1% of households in Springfield earn $25,000 to $34,999.
12.4% of households in Springfield earn $35,000 to $49,999.
16.8% of households in Springfield earn $50,000 to $74,999.
11.4% of households in Springfield earn $75,000 to $99,999.
16.2% of households in Springfield earn $100,000 to $149,999.
7.1% of households in Springfield earn $150,000 to $199,999.
9.1% of households in Springfield earn $200,000 or more.
| Income | Springfield | IL | USA |
|---|---|---|---|
| Less than $10,000 | 8.0% | 5.4% | 5.0% |
| $10,000 to $14,999 | 4.6% | 3.2% | 3.4% |
| $15,000 to $24,999 | 7.4% | 5.9% | 6.3% |
| $25,000 to $34,999 | 7.1% | 6.3% | 6.6% |
| $35,000 to $49,999 | 12.4% | 9.7% | 10.1% |
| $50,000 to $74,999 | 16.8% | 14.8% | 15.5% |
| $75,000 to $99,999 | 11.4% | 12.6% | 12.6% |
| $100,000 to $149,999 | 16.2% | 18.0% | 17.5% |
| $150,000 to $199,999 | 7.1% | 10.1% | 9.6% |
| $200,000 or more | 9.1% | 13.8% | 13.4% |
Source: U.S. Census ACS 5-year estimates (2024)


