Sycamore SnackAbility
Overall SnackAbility
Crime in Sycamore summary. We use data from the FBI to determine the crime rates in Sycamore. Key points include:
There were 197 total crimes in Sycamore in the last reporting year.
The overall crime rate per 100,000 people in Sycamore is 1,052.5 / 100k people.
The violent crime rate per 100,000 people in Sycamore is 42.7 / 100k people.
The property crime rate per 100,000 people in Sycamore is 1,009.7 / 100k people.
Overall, crime in Sycamore is -50.34% below the national average.
Total Crimes
Below National Average
Crime In Sycamore Comparison Table
| Statistic | Count Raw |
Sycamore / 100k People |
Illinois / 100k People |
National / 100k People |
|---|---|---|---|---|
| Total Crimes Per 100K | 197 | 1,052.5 | 2,004.4 | 2,119.2 |
| Violent Crime | 8 | 42.7 | 289.2 | 359.0 |
| Murder | 1 | 5.3 | 5.8 | 5.0 |
| Robbery | 0 | 0.0 | 90.2 | 61.0 |
| Aggravated Assault | 4 | 21.4 | 146.3 | 256.0 |
| Property Crime | 189 | 1,009.7 | 1,715.2 | 1,760.0 |
| Burglary | 16 | 85.5 | 290.5 | 229.0 |
| Larceny | 155 | 828.1 | 1,134.4 | 1,272.0 |
| Car Theft | 18 | 96.2 | 290.4 | 259.0 |
Source: FBI Uniform Crime Reporting (2024)
Cost of living in Sycamore summary. We use data on the cost of living to determine how expensive it is to live in Sycamore. Real estate prices drive most of the variance in cost of living around Illinois. Key points include:
The cost of living in Sycamore is 102 with 100 being average.
The cost of living in Sycamore is 1.0x higher than the national average.
The median home value in Sycamore is $313,783.
The median income in Sycamore is $84,120.
Sycamore's Overall Cost Of Living
Higher Than The National Average
Cost Of Living In Sycamore Comparison Table
| Living Expense | Sycamore | Illinois | National Average |
|---|---|---|---|
| Overall | 102 | 98 | 100 |
| Services | 102 | 99 | 100 |
| Groceries | 101 | 99 | 100 |
| Health | 105 | 96 | 100 |
| Housing | 103 | 101 | 100 |
| Transportation | 98 | 99 | 100 |
| Utilities | 103 | 101 | 100 |
Source: Cost of living index, normalized to US average = 100
Sycamore, IL Weather
The average high in Sycamore is 58.1° and the average low is 38.4°.
There are 67.0 days of precipitation each year.
Expect an average of 36.7 inches of precipitation each year with 31.4 inches of snow.
| Stat | Sycamore |
|---|---|
| Average Annual High | 58.1 |
| Average Annual Low | 38.4 |
| Annual Precipitation Days | 67.0 |
| Average Annual Precipitation | 36.7 |
| Average Annual Snowfall | 31.4 |
Average High
Days of Rain
Source: NOAA climate normals (30-year)
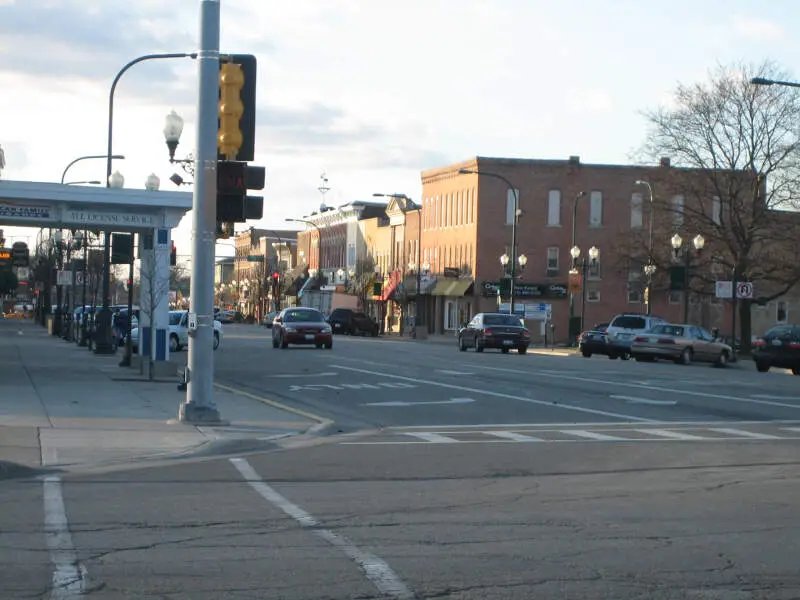
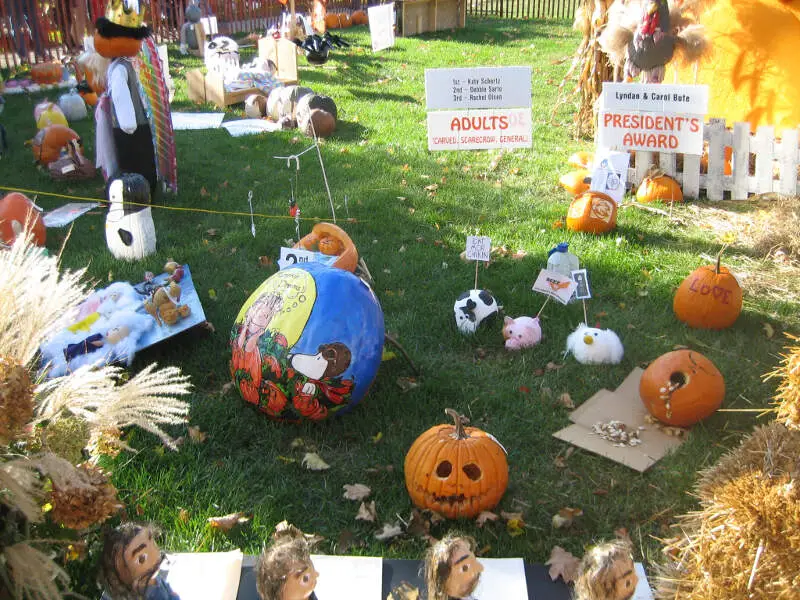
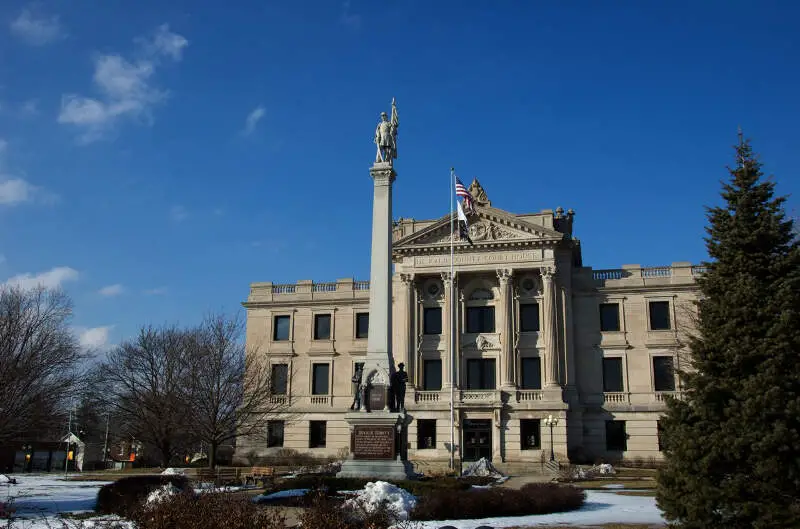
Sycamore, IL Photos
Rankings & Articles For Sycamore


Locations Around Sycamore
Map Of Sycamore, IL
Best Places Around Sycamore
Geneva, IL
Population 21,258
St. Charles, IL
Population 32,854
Campton Hills, IL
Population 10,877
Genoa, IL
Population 5,492
Huntley, IL
Population 28,005
South Elgin, IL
Population 24,217
Sugar Grove, IL
Population 9,240
Gilberts, IL
Population 8,606
Elburn, IL
Population 6,354
Hampshire, IL
Population 8,524
Sycamore Demographics And Statistics
Population over time in Sycamore
The current population in Sycamore is 18,559. The population has increased 10.5% from 2010.
| Year | Population | % Change |
|---|---|---|
| 2024 | 18,559 | 1.7% |
| 2023 | 18,243 | 0.4% |
| 2022 | 18,171 | 0.1% |
| 2021 | 18,144 | 0.9% |
| 2020 | 17,990 | 1.5% |
| 2019 | 17,726 | 0.0% |
| 2018 | 17,725 | 0.1% |
| 2017 | 17,712 | 0.6% |
| 2016 | 17,611 | 0.2% |
| 2015 | 17,572 | 0.6% |
| 2014 | 17,473 | -0.5% |
| 2013 | 17,566 | 0.3% |
| 2012 | 17,505 | 1.9% |
| 2011 | 17,179 | 2.3% |
| 2010 | 16,800 | - |
Race / Ethnicity in Sycamore
See the full breakdown
Sycamore is:
80.8% White with 15,004 White residents.
3.0% African American with 564 African American residents.
0.0% American Indian with 0 American Indian residents.
1.9% Asian with 353 Asian residents.
0.0% Hawaiian with 0 Hawaiian residents.
0.0% Other with 7 Other residents.
2.9% Two Or More with 540 Two Or More residents.
11.3% Hispanic with 2,091 Hispanic residents.
| Race | Sycamore | IL | USA |
|---|---|---|---|
| White | 80.8% | 58.1% | 57.4% |
| African American | 3.0% | 13.3% | 11.9% |
| American Indian | 0.0% | 0.1% | 0.5% |
| Asian | 1.9% | 5.9% | 5.9% |
| Hawaiian | 0.0% | 0.0% | 0.2% |
| Other | 0.0% | 0.4% | 0.6% |
| Two Or More | 2.9% | 3.4% | 4.3% |
| Hispanic | 11.3% | 18.8% | 19.3% |
Gender in Sycamore
See the full breakdown
Sycamore is 51.9% female with 9,625 female residents.
Sycamore is 48.1% male with 8,934 male residents.
| Gender | Sycamore | IL | USA |
|---|---|---|---|
| Female | 51.9% | 50.6% | 50.5% |
| Male | 48.1% | 49.4% | 49.5% |
Highest level of educational attainment in Sycamore for adults over 25
See the full breakdown
2.0% of adults in Sycamore completed < 9th grade.
2.0% of adults in Sycamore completed 9-12th grade.
20.0% of adults in Sycamore completed high school / ged.
22.0% of adults in Sycamore completed some college.
8.0% of adults in Sycamore completed associate's degree.
26.0% of adults in Sycamore completed bachelor's degree.
15.0% of adults in Sycamore completed master's degree.
2.0% of adults in Sycamore completed professional degree.
3.0% of adults in Sycamore completed doctorate degree.
| Education | Sycamore | IL | USA |
|---|---|---|---|
| < 9th Grade | 2.0% | 5.0% | 4.0% |
| 9-12th Grade | 2.0% | 5.0% | 6.0% |
| High School / GED | 20.0% | 25.0% | 26.0% |
| Some College | 22.0% | 19.0% | 19.0% |
| Associate's Degree | 8.0% | 8.0% | 9.0% |
| Bachelor's Degree | 26.0% | 23.0% | 22.0% |
| Master's Degree | 15.0% | 11.0% | 10.0% |
| Professional Degree | 2.0% | 2.0% | 2.0% |
| Doctorate Degree | 3.0% | 2.0% | 2.0% |
Household Income For Sycamore, Illinois
See the full breakdown
1.6% of households in Sycamore earn Less than $10,000.
2.4% of households in Sycamore earn $10,000 to $14,999.
5.1% of households in Sycamore earn $15,000 to $24,999.
6.7% of households in Sycamore earn $25,000 to $34,999.
9.6% of households in Sycamore earn $35,000 to $49,999.
19.2% of households in Sycamore earn $50,000 to $74,999.
12.6% of households in Sycamore earn $75,000 to $99,999.
17.2% of households in Sycamore earn $100,000 to $149,999.
14.2% of households in Sycamore earn $150,000 to $199,999.
11.5% of households in Sycamore earn $200,000 or more.
| Income | Sycamore | IL | USA |
|---|---|---|---|
| Less than $10,000 | 1.6% | 5.4% | 5.0% |
| $10,000 to $14,999 | 2.4% | 3.2% | 3.4% |
| $15,000 to $24,999 | 5.1% | 5.9% | 6.3% |
| $25,000 to $34,999 | 6.7% | 6.3% | 6.6% |
| $35,000 to $49,999 | 9.6% | 9.7% | 10.1% |
| $50,000 to $74,999 | 19.2% | 14.8% | 15.5% |
| $75,000 to $99,999 | 12.6% | 12.6% | 12.6% |
| $100,000 to $149,999 | 17.2% | 18.0% | 17.5% |
| $150,000 to $199,999 | 14.2% | 10.1% | 9.6% |
| $200,000 or more | 11.5% | 13.8% | 13.4% |
Source: U.S. Census ACS 5-year estimates (2024)


