Winfield, IL
Demographics And Statistics
Living In Winfield, Illinois Summary
Life in Winfield research summary. HomeSnacks has been using Saturday Night Science to research the quality of life in Winfield over the past nine years using Census, FBI, Zillow, and other primary data sources. Based on the most recently available data, we found the following about life in Winfield:
The population in Winfield is 9,982.
The median home value in Winfield is $450,118.
The median income in Winfield is $143,102.
The cost of living in Winfield is 127 which is 1.3x higher than the national average.
The median rent in Winfield is $1,381.
The unemployment rate in Winfield is 5.0%.
The poverty rate in Winfield is 2.5%.
The average high in Winfield is 59.1° and the average low is 38.9°.
Winfield SnackAbility
Overall SnackAbility
Winfield, IL Crime Report
Crime in Winfield summary. We use data from the FBI to determine the crime rates in Winfield. Key points include:
There were 41 total crimes in Winfield in the last reporting year.
The overall crime rate per 100,000 people in Winfield is 404.5 / 100k people.
The violent crime rate per 100,000 people in Winfield is 59.2 / 100k people.
The property crime rate per 100,000 people in Winfield is 345.3 / 100k people.
Overall, crime in Winfield is -80.91% below the national average.
Total Crimes
Below National Average
Crime In Winfield Comparison Table
| Statistic | Count Raw |
Winfield / 100k People |
Illinois / 100k People |
National / 100k People |
|---|---|---|---|---|
| Total Crimes Per 100K | 41 | 404.5 | 2,004.4 | 2,119.2 |
| Violent Crime | 6 | 59.2 | 289.2 | 359.0 |
| Murder | 0 | 0.0 | 5.8 | 5.0 |
| Robbery | 0 | 0.0 | 90.2 | 61.0 |
| Aggravated Assault | 3 | 29.6 | 146.3 | 256.0 |
| Property Crime | 35 | 345.3 | 1,715.2 | 1,760.0 |
| Burglary | 1 | 9.9 | 290.5 | 229.0 |
| Larceny | 31 | 305.8 | 1,134.4 | 1,272.0 |
| Car Theft | 3 | 29.6 | 290.4 | 259.0 |
Winfield, IL Cost Of Living
Cost of living in Winfield summary. We use data on the cost of living to determine how expensive it is to live in Winfield. Real estate prices drive most of the variance in cost of living around Illinois. Key points include:
The cost of living in Winfield is 127 with 100 being average.
The cost of living in Winfield is 1.3x higher than the national average.
The median home value in Winfield is $450,118.
The median income in Winfield is $143,102.
Winfield's Overall Cost Of Living
Higher Than The National Average
Cost Of Living In Winfield Comparison Table
| Living Expense | Winfield | Illinois | National Average | |
|---|---|---|---|---|
| Overall | 127 | 97 | 100 | |
| Services | 107 | 95 | 100 | |
| Groceries | 99 | 99 | 100 | |
| Health | 96 | 93 | 100 | |
| Housing | 188 | 95 | 100 | |
| Transportation | 112 | 102 | 100 | |
| Utilities | 80 | 91 | 100 | |
Winfield, IL Weather
The average high in Winfield is 59.1° and the average low is 38.9°.
There are 69.1 days of precipitation each year.
Expect an average of 37.1 inches of precipitation each year with 29.7 inches of snow.
| Stat | Winfield |
|---|---|
| Average Annual High | 59.1 |
| Average Annual Low | 38.9 |
| Annual Precipitation Days | 69.1 |
| Average Annual Precipitation | 37.1 |
| Average Annual Snowfall | 29.7 |
Average High
Days of Rain
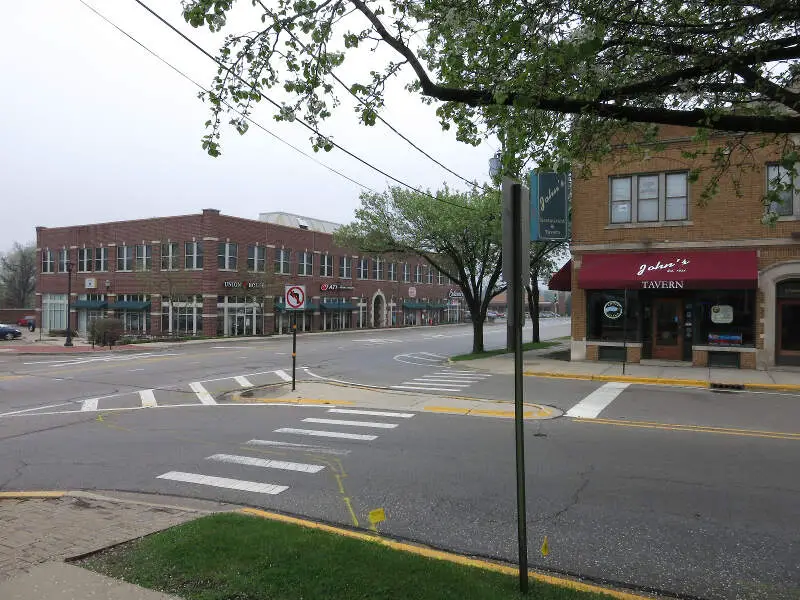
Winfield, IL Photos


Rankings for Winfield in Illinois


Locations Around Winfield
Map Of Winfield, IL
Best Places Around Winfield
Hinsdale, IL
Population 17,155
Elmhurst, IL
Population 45,538
Clarendon Hills, IL
Population 8,642
Park Ridge, IL
Population 39,241
Glen Ellyn, IL
Population 28,270
Wheaton, IL
Population 53,453
Arlington Heights, IL
Population 76,220
Bartlett, IL
Population 40,531
Burr Ridge, IL
Population 11,119
Naperville, IL
Population 149,424
Winfield Demographics And Statistics
Population over time in Winfield
The current population in Winfield is 9,982. The population has increased 10.4% from 2010.
| Year | Population | % Change |
|---|---|---|
| 2023 | 9,982 | 0.4% |
| 2022 | 9,947 | 1.0% |
| 2021 | 9,852 | 1.7% |
| 2020 | 9,683 | -0.2% |
| 2019 | 9,700 | -0.1% |
| 2018 | 9,708 | 0.7% |
| 2017 | 9,641 | 1.0% |
| 2016 | 9,543 | 0.5% |
| 2015 | 9,492 | 1.3% |
| 2014 | 9,368 | 0.9% |
| 2013 | 9,280 | 1.2% |
| 2012 | 9,168 | 1.7% |
| 2011 | 9,012 | -0.3% |
| 2010 | 9,041 | - |
Race / Ethnicity in Winfield
Winfield is:
79.8% White with 7,967 White residents.
1.1% African American with 107 African American residents.
0.0% American Indian with 0 American Indian residents.
4.5% Asian with 454 Asian residents.
0.0% Hawaiian with 0 Hawaiian residents.
0.2% Other with 18 Other residents.
2.6% Two Or More with 259 Two Or More residents.
11.8% Hispanic with 1,177 Hispanic residents.
| Race | Winfield | IL | USA |
|---|---|---|---|
| White | 79.8% | 58.7% | 58.2% |
| African American | 1.1% | 13.6% | 12.0% |
| American Indian | 0.0% | 0.1% | 0.5% |
| Asian | 4.5% | 5.8% | 5.7% |
| Hawaiian | 0.0% | 0.0% | 0.2% |
| Other | 0.2% | 0.3% | 0.5% |
| Two Or More | 2.6% | 3.0% | 3.9% |
| Hispanic | 11.8% | 18.5% | 19.0% |
Gender in Winfield
Winfield is 49.0% female with 4,888 female residents.
Winfield is 51.0% male with 5,094 male residents.
| Gender | Winfield | IL | USA |
|---|---|---|---|
| Female | 49.0% | 50.6% | 50.5% |
| Male | 51.0% | 49.4% | 49.5% |
Highest level of educational attainment in Winfield for adults over 25
1.0% of adults in Winfield completed < 9th grade.
1.0% of adults in Winfield completed 9-12th grade.
14.0% of adults in Winfield completed high school / ged.
17.0% of adults in Winfield completed some college.
7.0% of adults in Winfield completed associate's degree.
35.0% of adults in Winfield completed bachelor's degree.
18.0% of adults in Winfield completed master's degree.
5.0% of adults in Winfield completed professional degree.
2.0% of adults in Winfield completed doctorate degree.
| Education | Winfield | IL | USA |
|---|---|---|---|
| < 9th Grade | 1.0% | 5.0% | 5.0% |
| 9-12th Grade | 1.0% | 5.0% | 6.0% |
| High School / GED | 14.0% | 25.0% | 26.0% |
| Some College | 17.0% | 20.0% | 19.0% |
| Associate's Degree | 7.0% | 8.0% | 9.0% |
| Bachelor's Degree | 35.0% | 22.0% | 21.0% |
| Master's Degree | 18.0% | 11.0% | 10.0% |
| Professional Degree | 5.0% | 2.0% | 2.0% |
| Doctorate Degree | 2.0% | 2.0% | 2.0% |
Household Income For Winfield, Illinois
1.5% of households in Winfield earn Less than $10,000.
0.6% of households in Winfield earn $10,000 to $14,999.
1.7% of households in Winfield earn $15,000 to $24,999.
3.2% of households in Winfield earn $25,000 to $34,999.
3.6% of households in Winfield earn $35,000 to $49,999.
14.0% of households in Winfield earn $50,000 to $74,999.
11.3% of households in Winfield earn $75,000 to $99,999.
18.5% of households in Winfield earn $100,000 to $149,999.
16.7% of households in Winfield earn $150,000 to $199,999.
28.7% of households in Winfield earn $200,000 or more.
| Income | Winfield | IL | USA |
|---|---|---|---|
| Less than $10,000 | 1.5% | 5.2% | 4.9% |
| $10,000 to $14,999 | 0.6% | 3.4% | 3.6% |
| $15,000 to $24,999 | 1.7% | 6.2% | 6.6% |
| $25,000 to $34,999 | 3.2% | 6.5% | 6.8% |
| $35,000 to $49,999 | 3.6% | 9.9% | 10.4% |
| $50,000 to $74,999 | 14.0% | 15.1% | 15.7% |
| $75,000 to $99,999 | 11.3% | 12.7% | 12.7% |
| $100,000 to $149,999 | 18.5% | 17.9% | 17.4% |
| $150,000 to $199,999 | 16.7% | 9.9% | 9.3% |
| $200,000 or more | 28.7% | 13.1% | 12.6% |


