Woodstock SnackAbility
Overall SnackAbility
Crime in Woodstock summary. We use data from the FBI to determine the crime rates in Woodstock. Key points include:
There were 164 total crimes in Woodstock in the last reporting year.
The overall crime rate per 100,000 people in Woodstock is 637.4 / 100k people.
The violent crime rate per 100,000 people in Woodstock is 93.3 / 100k people.
The property crime rate per 100,000 people in Woodstock is 544.1 / 100k people.
Overall, crime in Woodstock is -69.92% below the national average.
Total Crimes
Below National Average
Crime In Woodstock Comparison Table
| Statistic | Count Raw |
Woodstock / 100k People |
Illinois / 100k People |
National / 100k People |
|---|---|---|---|---|
| Total Crimes Per 100K | 164 | 637.4 | 2,004.4 | 2,119.2 |
| Violent Crime | 24 | 93.3 | 289.2 | 359.0 |
| Murder | 0 | 0.0 | 5.8 | 5.0 |
| Robbery | 1 | 3.9 | 90.2 | 61.0 |
| Aggravated Assault | 13 | 50.5 | 146.3 | 256.0 |
| Property Crime | 140 | 544.1 | 1,715.2 | 1,760.0 |
| Burglary | 9 | 35.0 | 290.5 | 229.0 |
| Larceny | 120 | 466.4 | 1,134.4 | 1,272.0 |
| Car Theft | 11 | 42.7 | 290.4 | 259.0 |
Source: FBI Uniform Crime Reporting (2024)
Cost of living in Woodstock summary. We use data on the cost of living to determine how expensive it is to live in Woodstock. Real estate prices drive most of the variance in cost of living around Illinois. Key points include:
The cost of living in Woodstock is 99 with 100 being average.
The cost of living in Woodstock is 1.0x lower than the national average.
The median home value in Woodstock is $326,639.
The median income in Woodstock is $82,758.
Woodstock's Overall Cost Of Living
Lower Than The National Average
Cost Of Living In Woodstock Comparison Table
| Living Expense | Woodstock | Illinois | National Average |
|---|---|---|---|
| Overall | 99 | 98 | 100 |
| Services | 102 | 99 | 100 |
| Groceries | 100 | 99 | 100 |
| Health | 100 | 96 | 100 |
| Housing | 99 | 101 | 100 |
| Transportation | 99 | 99 | 100 |
| Utilities | 97 | 101 | 100 |
Source: Cost of living index, normalized to US average = 100
Woodstock, IL Weather
The average high in Woodstock is 57.7° and the average low is 37.9°.
There are 73.0 days of precipitation each year.
Expect an average of 36.6 inches of precipitation each year with 34.2 inches of snow.
| Stat | Woodstock |
|---|---|
| Average Annual High | 57.7 |
| Average Annual Low | 37.9 |
| Annual Precipitation Days | 73.0 |
| Average Annual Precipitation | 36.6 |
| Average Annual Snowfall | 34.2 |
Average High
Days of Rain
Source: NOAA climate normals (30-year)
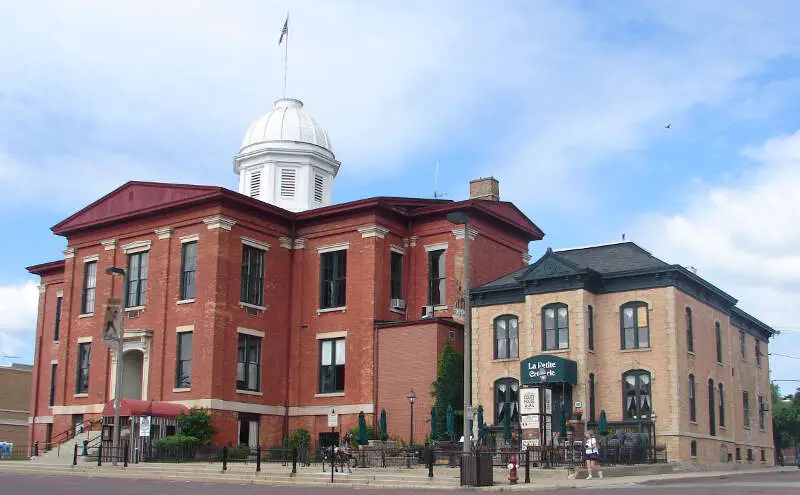
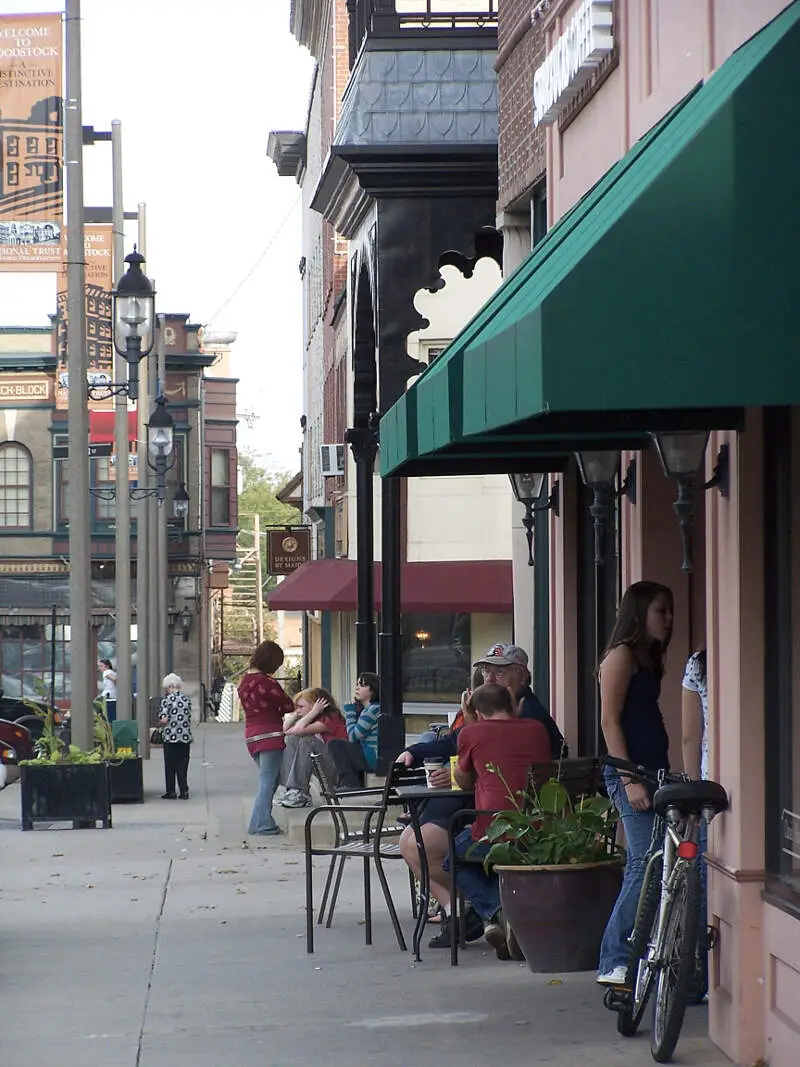
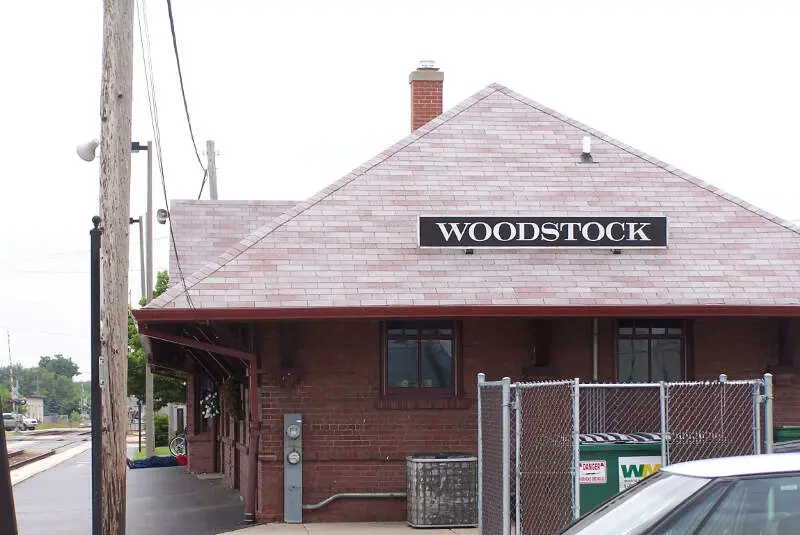
Woodstock, IL Photos

Rankings & Articles For Woodstock


Locations Around Woodstock
Map Of Woodstock, IL
Best Places Around Woodstock
Lake Zurich, IL
Population 19,832
Hawthorn Woods, IL
Population 9,143
Barrington, IL
Population 11,077
Cary, IL
Population 17,923
Spring Grove, IL
Population 5,917
Lake Villa, IL
Population 8,683
Algonquin, IL
Population 30,067
Lake in the Hills, IL
Population 28,800
Wauconda, IL
Population 14,027
Round Lake, IL
Population 18,628
Woodstock Demographics And Statistics
Population over time in Woodstock
The current population in Woodstock is 26,147. The population has increased 7.1% from 2010.
| Year | Population | % Change |
|---|---|---|
| 2024 | 26,147 | -0.6% |
| 2023 | 26,316 | 0.9% |
| 2022 | 26,084 | 1.0% |
| 2021 | 25,829 | 1.7% |
| 2020 | 25,391 | 0.2% |
| 2019 | 25,348 | 0.6% |
| 2018 | 25,198 | -0.6% |
| 2017 | 25,340 | 0.4% |
| 2016 | 25,232 | -0.1% |
| 2015 | 25,247 | 0.5% |
| 2014 | 25,121 | 0.8% |
| 2013 | 24,926 | 0.6% |
| 2012 | 24,781 | 1.1% |
| 2011 | 24,512 | 0.4% |
| 2010 | 24,414 | - |
Race / Ethnicity in Woodstock
See the full breakdown
Woodstock is:
70.1% White with 18,321 White residents.
2.7% African American with 699 African American residents.
0.1% American Indian with 21 American Indian residents.
2.2% Asian with 570 Asian residents.
0.1% Hawaiian with 17 Hawaiian residents.
0.1% Other with 26 Other residents.
1.5% Two Or More with 382 Two Or More residents.
23.4% Hispanic with 6,111 Hispanic residents.
| Race | Woodstock | IL | USA |
|---|---|---|---|
| White | 70.1% | 58.1% | 57.4% |
| African American | 2.7% | 13.3% | 11.9% |
| American Indian | 0.1% | 0.1% | 0.5% |
| Asian | 2.2% | 5.9% | 5.9% |
| Hawaiian | 0.1% | 0.0% | 0.2% |
| Other | 0.1% | 0.4% | 0.6% |
| Two Or More | 1.5% | 3.4% | 4.3% |
| Hispanic | 23.4% | 18.8% | 19.3% |
Gender in Woodstock
See the full breakdown
Woodstock is 50.7% female with 13,244 female residents.
Woodstock is 49.3% male with 12,902 male residents.
| Gender | Woodstock | IL | USA |
|---|---|---|---|
| Female | 50.7% | 50.6% | 50.5% |
| Male | 49.3% | 49.4% | 49.5% |
Highest level of educational attainment in Woodstock for adults over 25
See the full breakdown
6.0% of adults in Woodstock completed < 9th grade.
6.0% of adults in Woodstock completed 9-12th grade.
27.0% of adults in Woodstock completed high school / ged.
23.0% of adults in Woodstock completed some college.
8.0% of adults in Woodstock completed associate's degree.
19.0% of adults in Woodstock completed bachelor's degree.
9.0% of adults in Woodstock completed master's degree.
1.0% of adults in Woodstock completed professional degree.
1.0% of adults in Woodstock completed doctorate degree.
| Education | Woodstock | IL | USA |
|---|---|---|---|
| < 9th Grade | 6.0% | 5.0% | 4.0% |
| 9-12th Grade | 6.0% | 5.0% | 6.0% |
| High School / GED | 27.0% | 25.0% | 26.0% |
| Some College | 23.0% | 19.0% | 19.0% |
| Associate's Degree | 8.0% | 8.0% | 9.0% |
| Bachelor's Degree | 19.0% | 23.0% | 22.0% |
| Master's Degree | 9.0% | 11.0% | 10.0% |
| Professional Degree | 1.0% | 2.0% | 2.0% |
| Doctorate Degree | 1.0% | 2.0% | 2.0% |
Household Income For Woodstock, Illinois
See the full breakdown
4.1% of households in Woodstock earn Less than $10,000.
1.8% of households in Woodstock earn $10,000 to $14,999.
5.8% of households in Woodstock earn $15,000 to $24,999.
5.9% of households in Woodstock earn $25,000 to $34,999.
10.2% of households in Woodstock earn $35,000 to $49,999.
15.0% of households in Woodstock earn $50,000 to $74,999.
15.2% of households in Woodstock earn $75,000 to $99,999.
22.4% of households in Woodstock earn $100,000 to $149,999.
9.2% of households in Woodstock earn $150,000 to $199,999.
10.5% of households in Woodstock earn $200,000 or more.
| Income | Woodstock | IL | USA |
|---|---|---|---|
| Less than $10,000 | 4.1% | 5.4% | 5.0% |
| $10,000 to $14,999 | 1.8% | 3.2% | 3.4% |
| $15,000 to $24,999 | 5.8% | 5.9% | 6.3% |
| $25,000 to $34,999 | 5.9% | 6.3% | 6.6% |
| $35,000 to $49,999 | 10.2% | 9.7% | 10.1% |
| $50,000 to $74,999 | 15.0% | 14.8% | 15.5% |
| $75,000 to $99,999 | 15.2% | 12.6% | 12.6% |
| $100,000 to $149,999 | 22.4% | 18.0% | 17.5% |
| $150,000 to $199,999 | 9.2% | 10.1% | 9.6% |
| $200,000 or more | 10.5% | 13.8% | 13.4% |
Source: U.S. Census ACS 5-year estimates (2024)


