Yorkville SnackAbility
Overall SnackAbility
Crime in Yorkville summary. We use data from the FBI to determine the crime rates in Yorkville. Key points include:
There were 119 total crimes in Yorkville in the last reporting year.
The overall crime rate per 100,000 people in Yorkville is 461.5 / 100k people.
The violent crime rate per 100,000 people in Yorkville is 73.7 / 100k people.
The property crime rate per 100,000 people in Yorkville is 387.8 / 100k people.
Overall, crime in Yorkville is -78.23% below the national average.
Total Crimes
Below National Average
Crime In Yorkville Comparison Table
| Statistic | Count Raw |
Yorkville / 100k People |
Illinois / 100k People |
National / 100k People |
|---|---|---|---|---|
| Total Crimes Per 100K | 119 | 461.5 | 2,004.4 | 2,119.2 |
| Violent Crime | 19 | 73.7 | 289.2 | 359.0 |
| Murder | 0 | 0.0 | 5.8 | 5.0 |
| Robbery | 0 | 0.0 | 90.2 | 61.0 |
| Aggravated Assault | 3 | 11.6 | 146.3 | 256.0 |
| Property Crime | 100 | 387.8 | 1,715.2 | 1,760.0 |
| Burglary | 21 | 81.4 | 290.5 | 229.0 |
| Larceny | 78 | 302.5 | 1,134.4 | 1,272.0 |
| Car Theft | 1 | 3.9 | 290.4 | 259.0 |
Source: FBI Uniform Crime Reporting (2024)
Cost of living in Yorkville summary. We use data on the cost of living to determine how expensive it is to live in Yorkville. Real estate prices drive most of the variance in cost of living around Illinois. Key points include:
The cost of living in Yorkville is 113 with 100 being average.
The cost of living in Yorkville is 1.1x higher than the national average.
The median home value in Yorkville is $399,862.
The median income in Yorkville is $108,513.
Yorkville's Overall Cost Of Living
Higher Than The National Average
Cost Of Living In Yorkville Comparison Table
| Living Expense | Yorkville | Illinois | National Average |
|---|---|---|---|
| Overall | 113 | 98 | 100 |
| Services | 97 | 99 | 100 |
| Groceries | 100 | 99 | 100 |
| Health | 143 | 96 | 100 |
| Housing | 101 | 101 | 100 |
| Transportation | 103 | 99 | 100 |
| Utilities | 94 | 101 | 100 |
Source: Cost of living index, normalized to US average = 100
Yorkville, IL Weather
The average high in Yorkville is 59.4° and the average low is 39.2°.
There are 71.8 days of precipitation each year.
Expect an average of 36.3 inches of precipitation each year with 27.0 inches of snow.
| Stat | Yorkville |
|---|---|
| Average Annual High | 59.4 |
| Average Annual Low | 39.2 |
| Annual Precipitation Days | 71.8 |
| Average Annual Precipitation | 36.3 |
| Average Annual Snowfall | 27.0 |
Average High
Days of Rain
Source: NOAA climate normals (30-year)
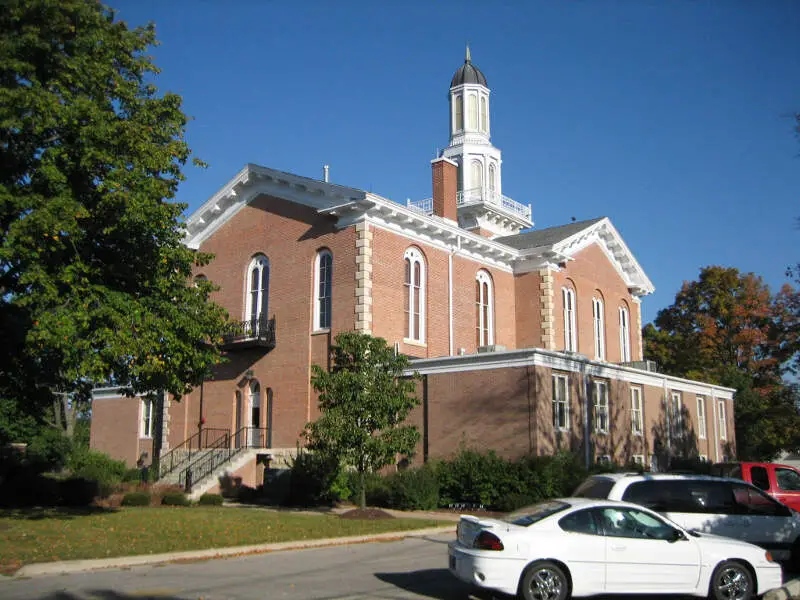
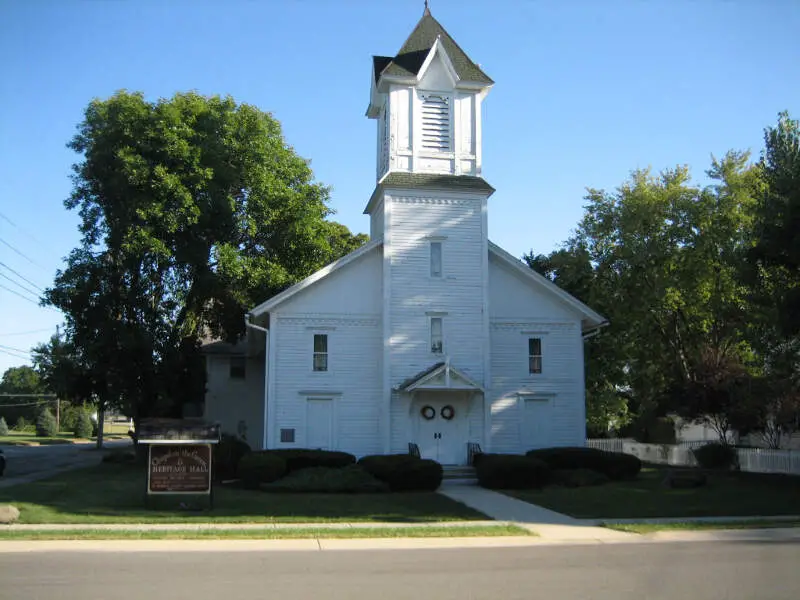
Yorkville, IL Photos
Rankings & Articles For Yorkville


Locations Around Yorkville
Map Of Yorkville, IL
Best Places Around Yorkville
Naperville, IL
Population 150,692
Warrenville, IL
Population 14,718
Geneva, IL
Population 21,258
Batavia, IL
Population 27,151
Plainfield, IL
Population 46,708
Boulder Hill, IL
Population 8,989
St. Charles, IL
Population 32,854
Oswego, IL
Population 36,375
Bolingbrook, IL
Population 74,096
Sugar Grove, IL
Population 9,240
Yorkville Demographics And Statistics
Population over time in Yorkville
The current population in Yorkville is 23,617. The population has increased 56.8% from 2010.
| Year | Population | % Change |
|---|---|---|
| 2024 | 23,617 | 5.7% |
| 2023 | 22,350 | 5.1% |
| 2022 | 21,273 | 3.8% |
| 2021 | 20,503 | 5.8% |
| 2020 | 19,386 | 0.2% |
| 2019 | 19,352 | 1.1% |
| 2018 | 19,145 | 2.4% |
| 2017 | 18,691 | 1.4% |
| 2016 | 18,436 | 1.2% |
| 2015 | 18,222 | 1.3% |
| 2014 | 17,980 | 2.7% |
| 2013 | 17,513 | 2.7% |
| 2012 | 17,055 | 6.4% |
| 2011 | 16,023 | 6.4% |
| 2010 | 15,065 | - |
Race / Ethnicity in Yorkville
See the full breakdown
Yorkville is:
68.6% White with 16,190 White residents.
6.7% African American with 1,593 African American residents.
0.1% American Indian with 29 American Indian residents.
3.1% Asian with 722 Asian residents.
0.0% Hawaiian with 0 Hawaiian residents.
0.1% Other with 32 Other residents.
2.0% Two Or More with 476 Two Or More residents.
19.4% Hispanic with 4,575 Hispanic residents.
| Race | Yorkville | IL | USA |
|---|---|---|---|
| White | 68.6% | 58.1% | 57.4% |
| African American | 6.7% | 13.3% | 11.9% |
| American Indian | 0.1% | 0.1% | 0.5% |
| Asian | 3.1% | 5.9% | 5.9% |
| Hawaiian | 0.0% | 0.0% | 0.2% |
| Other | 0.1% | 0.4% | 0.6% |
| Two Or More | 2.0% | 3.4% | 4.3% |
| Hispanic | 19.4% | 18.8% | 19.3% |
Gender in Yorkville
See the full breakdown
Yorkville is 49.9% female with 11,785 female residents.
Yorkville is 50.1% male with 11,832 male residents.
| Gender | Yorkville | IL | USA |
|---|---|---|---|
| Female | 49.9% | 50.6% | 50.5% |
| Male | 50.1% | 49.4% | 49.5% |
Highest level of educational attainment in Yorkville for adults over 25
See the full breakdown
0.0% of adults in Yorkville completed < 9th grade.
4.0% of adults in Yorkville completed 9-12th grade.
22.0% of adults in Yorkville completed high school / ged.
25.0% of adults in Yorkville completed some college.
10.0% of adults in Yorkville completed associate's degree.
30.0% of adults in Yorkville completed bachelor's degree.
7.0% of adults in Yorkville completed master's degree.
1.0% of adults in Yorkville completed professional degree.
1.0% of adults in Yorkville completed doctorate degree.
| Education | Yorkville | IL | USA |
|---|---|---|---|
| < 9th Grade | 0.0% | 5.0% | 4.0% |
| 9-12th Grade | 4.0% | 5.0% | 6.0% |
| High School / GED | 22.0% | 25.0% | 26.0% |
| Some College | 25.0% | 19.0% | 19.0% |
| Associate's Degree | 10.0% | 8.0% | 9.0% |
| Bachelor's Degree | 30.0% | 23.0% | 22.0% |
| Master's Degree | 7.0% | 11.0% | 10.0% |
| Professional Degree | 1.0% | 2.0% | 2.0% |
| Doctorate Degree | 1.0% | 2.0% | 2.0% |
Household Income For Yorkville, Illinois
See the full breakdown
1.5% of households in Yorkville earn Less than $10,000.
0.3% of households in Yorkville earn $10,000 to $14,999.
4.5% of households in Yorkville earn $15,000 to $24,999.
2.4% of households in Yorkville earn $25,000 to $34,999.
6.1% of households in Yorkville earn $35,000 to $49,999.
18.4% of households in Yorkville earn $50,000 to $74,999.
11.8% of households in Yorkville earn $75,000 to $99,999.
21.9% of households in Yorkville earn $100,000 to $149,999.
14.6% of households in Yorkville earn $150,000 to $199,999.
18.5% of households in Yorkville earn $200,000 or more.
| Income | Yorkville | IL | USA |
|---|---|---|---|
| Less than $10,000 | 1.5% | 5.4% | 5.0% |
| $10,000 to $14,999 | 0.3% | 3.2% | 3.4% |
| $15,000 to $24,999 | 4.5% | 5.9% | 6.3% |
| $25,000 to $34,999 | 2.4% | 6.3% | 6.6% |
| $35,000 to $49,999 | 6.1% | 9.7% | 10.1% |
| $50,000 to $74,999 | 18.4% | 14.8% | 15.5% |
| $75,000 to $99,999 | 11.8% | 12.6% | 12.6% |
| $100,000 to $149,999 | 21.9% | 18.0% | 17.5% |
| $150,000 to $199,999 | 14.6% | 10.1% | 9.6% |
| $200,000 or more | 18.5% | 13.8% | 13.4% |
Source: U.S. Census ACS 5-year estimates (2024)


