Kendallville, IN
Demographics And Statistics
Living In Kendallville, Indiana Summary
Life in Kendallville research summary. HomeSnacks has been using Saturday Night Science to research the quality of life in Kendallville over the past nine years using Census, FBI, Zillow, and other primary data sources. Based on the most recently available data, we found the following about life in Kendallville:
The population in Kendallville is 10,094.
The median home value in Kendallville is $215,658.
The median income in Kendallville is $60,909.
The cost of living in Kendallville is 88 which is 0.9x lower than the national average.
The median rent in Kendallville is $696.
The unemployment rate in Kendallville is 4.5%.
The poverty rate in Kendallville is 12.7%.
The average high in Kendallville is 59.5° and the average low is 39.9°.
Kendallville SnackAbility
Overall SnackAbility
Kendallville, IN Crime Report
Crime in Kendallville summary. We use data from the FBI to determine the crime rates in Kendallville. Key points include:
There were 93 total crimes in Kendallville in the last reporting year.
The overall crime rate per 100,000 people in Kendallville is 909.2 / 100k people.
The violent crime rate per 100,000 people in Kendallville is 205.3 / 100k people.
The property crime rate per 100,000 people in Kendallville is 703.9 / 100k people.
Overall, crime in Kendallville is -57.10% below the national average.
Total Crimes
Below National Average
Crime In Kendallville Comparison Table
| Statistic | Count Raw |
Kendallville / 100k People |
Indiana / 100k People |
National / 100k People |
|---|---|---|---|---|
| Total Crimes Per 100K | 93 | 909.2 | 1,691.5 | 2,119.2 |
| Violent Crime | 21 | 205.3 | 312.9 | 359.0 |
| Murder | 0 | 0.0 | 5.5 | 5.0 |
| Robbery | 0 | 0.0 | 34.5 | 61.0 |
| Aggravated Assault | 15 | 146.6 | 239.4 | 256.0 |
| Property Crime | 72 | 703.9 | 1,378.6 | 1,760.0 |
| Burglary | 2 | 19.6 | 176.8 | 229.0 |
| Larceny | 67 | 655.0 | 988.8 | 1,272.0 |
| Car Theft | 3 | 29.3 | 213.0 | 259.0 |
Kendallville, IN Cost Of Living
Cost of living in Kendallville summary. We use data on the cost of living to determine how expensive it is to live in Kendallville. Real estate prices drive most of the variance in cost of living around Indiana. Key points include:
The cost of living in Kendallville is 88 with 100 being average.
The cost of living in Kendallville is 0.9x lower than the national average.
The median home value in Kendallville is $215,658.
The median income in Kendallville is $60,909.
Kendallville's Overall Cost Of Living
Lower Than The National Average
Cost Of Living In Kendallville Comparison Table
| Living Expense | Kendallville | Indiana | National Average | |
|---|---|---|---|---|
| Overall | 88 | 92 | 100 | |
| Services | 96 | 95 | 100 | |
| Groceries | 102 | 97 | 100 | |
| Health | 97 | 94 | 100 | |
| Housing | 58 | 73 | 100 | |
| Transportation | 97 | 94 | 100 | |
| Utilities | 103 | 107 | 100 | |
Kendallville, IN Weather
The average high in Kendallville is 59.5° and the average low is 39.9°.
There are 75.4 days of precipitation each year.
Expect an average of 38.2 inches of precipitation each year with 28.4 inches of snow.
| Stat | Kendallville |
|---|---|
| Average Annual High | 59.5 |
| Average Annual Low | 39.9 |
| Annual Precipitation Days | 75.4 |
| Average Annual Precipitation | 38.2 |
| Average Annual Snowfall | 28.4 |
Average High
Days of Rain
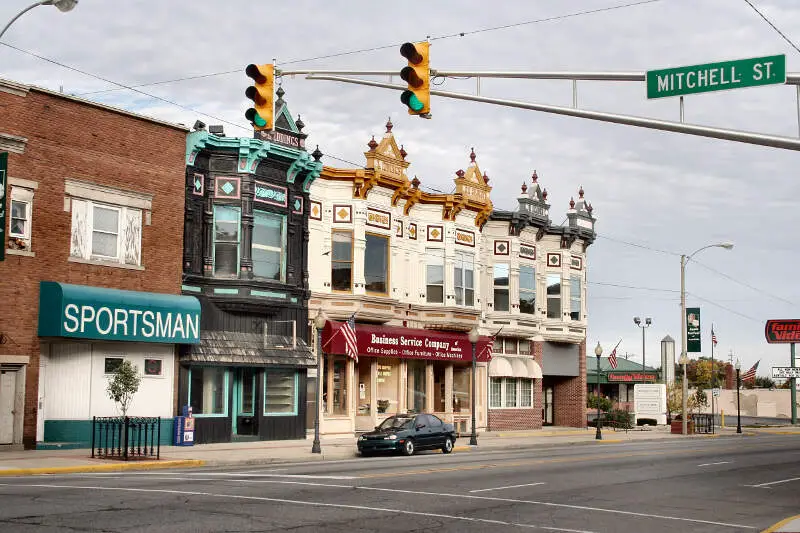
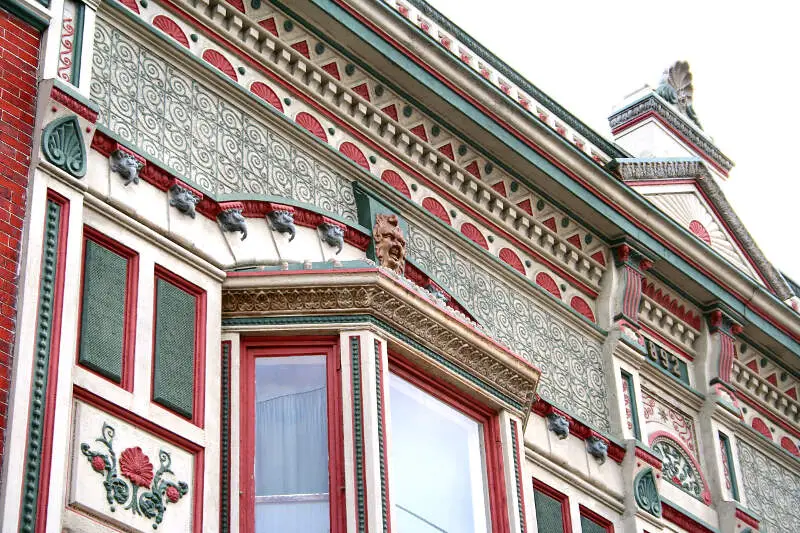
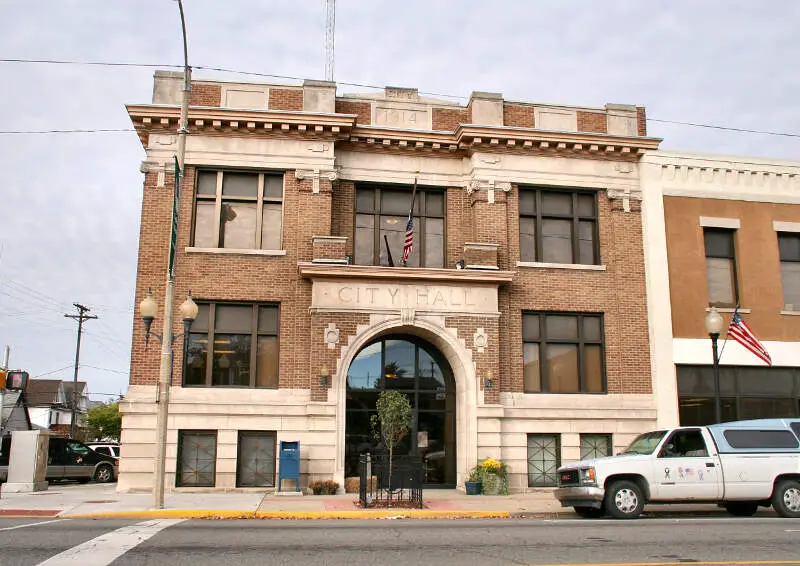
Kendallville, IN Photos
1 Reviews & Comments About Kendallville
/5

HomeSnacks User - 2019-05-08 18:00:16.194234
The m**h is crazy in Kendallville it has took over a lot of the town
Bixler is their main attraction in my eyes I grew up there and loved going to the lake I would watch out if your kids are growing up there though make sure they stay around the good crowd
Rankings for Kendallville in Indiana


Locations Around Kendallville
Map Of Kendallville, IN
Best Places Around Kendallville
Defiance, OH
Population 16,830
Bryan, OH
Population 8,664
Dunlap, IN
Population 6,602
Decatur, IN
Population 9,769
Nappanee, IN
Population 7,040
Granger, IN
Population 30,279
Goshen, IN
Population 34,374
Garrett, IN
Population 6,540
Sturgis, MI
Population 11,077
Auburn, IN
Population 13,464
Kendallville Demographics And Statistics
Population over time in Kendallville
The current population in Kendallville is 10,094. The population has increased 4.4% from 2010.
| Year | Population | % Change |
|---|---|---|
| 2023 | 10,094 | -0.8% |
| 2022 | 10,176 | 2.5% |
| 2021 | 9,926 | 6.0% |
| 2020 | 9,365 | 0.2% |
| 2019 | 9,347 | -1.8% |
| 2018 | 9,522 | -0.7% |
| 2017 | 9,592 | -3.9% |
| 2016 | 9,980 | 1.1% |
| 2015 | 9,870 | 0.2% |
| 2014 | 9,847 | -1.8% |
| 2013 | 10,027 | 0.8% |
| 2012 | 9,943 | 2.9% |
| 2011 | 9,661 | -0.1% |
| 2010 | 9,666 | - |
Race / Ethnicity in Kendallville
Kendallville is:
87.4% White with 8,827 White residents.
0.1% African American with 8 African American residents.
0.1% American Indian with 6 American Indian residents.
1.8% Asian with 186 Asian residents.
0.0% Hawaiian with 0 Hawaiian residents.
0.2% Other with 20 Other residents.
2.9% Two Or More with 297 Two Or More residents.
7.4% Hispanic with 750 Hispanic residents.
| Race | Kendallville | IN | USA |
|---|---|---|---|
| White | 87.4% | 76.1% | 58.2% |
| African American | 0.1% | 9.1% | 12.0% |
| American Indian | 0.1% | 0.1% | 0.5% |
| Asian | 1.8% | 2.5% | 5.7% |
| Hawaiian | 0.0% | 0.0% | 0.2% |
| Other | 0.2% | 0.4% | 0.5% |
| Two Or More | 2.9% | 3.4% | 3.9% |
| Hispanic | 7.4% | 8.4% | 19.0% |
Gender in Kendallville
Kendallville is 49.6% female with 5,003 female residents.
Kendallville is 50.4% male with 5,090 male residents.
| Gender | Kendallville | IN | USA |
|---|---|---|---|
| Female | 49.6% | 50.4% | 50.5% |
| Male | 50.4% | 49.6% | 49.5% |
Highest level of educational attainment in Kendallville for adults over 25
8.0% of adults in Kendallville completed < 9th grade.
11.0% of adults in Kendallville completed 9-12th grade.
41.0% of adults in Kendallville completed high school / ged.
19.0% of adults in Kendallville completed some college.
9.0% of adults in Kendallville completed associate's degree.
7.0% of adults in Kendallville completed bachelor's degree.
3.0% of adults in Kendallville completed master's degree.
1.0% of adults in Kendallville completed professional degree.
1.0% of adults in Kendallville completed doctorate degree.
| Education | Kendallville | IN | USA |
|---|---|---|---|
| < 9th Grade | 8.0% | 3.0% | 5.0% |
| 9-12th Grade | 11.0% | 6.0% | 6.0% |
| High School / GED | 41.0% | 33.0% | 26.0% |
| Some College | 19.0% | 20.0% | 19.0% |
| Associate's Degree | 9.0% | 9.0% | 9.0% |
| Bachelor's Degree | 7.0% | 18.0% | 21.0% |
| Master's Degree | 3.0% | 8.0% | 10.0% |
| Professional Degree | 1.0% | 2.0% | 2.0% |
| Doctorate Degree | 1.0% | 1.0% | 2.0% |
Household Income For Kendallville, Indiana
3.3% of households in Kendallville earn Less than $10,000.
6.1% of households in Kendallville earn $10,000 to $14,999.
15.4% of households in Kendallville earn $15,000 to $24,999.
7.8% of households in Kendallville earn $25,000 to $34,999.
7.9% of households in Kendallville earn $35,000 to $49,999.
24.6% of households in Kendallville earn $50,000 to $74,999.
13.0% of households in Kendallville earn $75,000 to $99,999.
13.7% of households in Kendallville earn $100,000 to $149,999.
5.4% of households in Kendallville earn $150,000 to $199,999.
2.9% of households in Kendallville earn $200,000 or more.
| Income | Kendallville | IN | USA |
|---|---|---|---|
| Less than $10,000 | 3.3% | 4.9% | 4.9% |
| $10,000 to $14,999 | 6.1% | 3.5% | 3.6% |
| $15,000 to $24,999 | 15.4% | 7.1% | 6.6% |
| $25,000 to $34,999 | 7.8% | 7.8% | 6.8% |
| $35,000 to $49,999 | 7.9% | 12.2% | 10.4% |
| $50,000 to $74,999 | 24.6% | 17.9% | 15.7% |
| $75,000 to $99,999 | 13.0% | 13.9% | 12.7% |
| $100,000 to $149,999 | 13.7% | 17.2% | 17.4% |
| $150,000 to $199,999 | 5.4% | 7.9% | 9.3% |
| $200,000 or more | 2.9% | 7.6% | 12.6% |


