Portland SnackAbility
Overall SnackAbility
Crime in Portland summary. We use data from the FBI to determine the crime rates in Portland. Key points include:
There were 69 total crimes in Portland in the last reporting year.
The overall crime rate per 100,000 people in Portland is 1,136.9 / 100k people.
The violent crime rate per 100,000 people in Portland is 181.2 / 100k people.
The property crime rate per 100,000 people in Portland is 955.7 / 100k people.
Overall, crime in Portland is -46.35% below the national average.
Total Crimes
Below National Average
Crime In Portland Comparison Table
| Statistic | Count Raw |
Portland / 100k People |
Indiana / 100k People |
National / 100k People |
|---|---|---|---|---|
| Total Crimes Per 100K | 69 | 1,136.9 | 1,691.5 | 2,119.2 |
| Violent Crime | 11 | 181.2 | 312.9 | 359.0 |
| Murder | 0 | 0.0 | 5.5 | 5.0 |
| Robbery | 0 | 0.0 | 34.5 | 61.0 |
| Aggravated Assault | 9 | 148.3 | 239.4 | 256.0 |
| Property Crime | 58 | 955.7 | 1,378.6 | 1,760.0 |
| Burglary | 0 | 0.0 | 176.8 | 229.0 |
| Larceny | 57 | 939.2 | 988.8 | 1,272.0 |
| Car Theft | 0 | 0.0 | 213.0 | 259.0 |
Source: FBI Uniform Crime Reporting (2024)
Cost of living in Portland summary. We use data on the cost of living to determine how expensive it is to live in Portland. Real estate prices drive most of the variance in cost of living around Indiana. Key points include:
The cost of living in Portland is 82 with 100 being average.
The cost of living in Portland is 0.8x lower than the national average.
The median home value in Portland is $162,774.
The median income in Portland is $51,513.
Portland's Overall Cost Of Living
Lower Than The National Average
Cost Of Living In Portland Comparison Table
| Living Expense | Portland | Indiana | National Average |
|---|---|---|---|
| Overall | 82 | 90 | 100 |
| Services | 98 | 97 | 100 |
| Groceries | 97 | 95 | 100 |
| Health | 53 | 72 | 100 |
| Housing | 92 | 98 | 100 |
| Transportation | 95 | 94 | 100 |
| Utilities | 91 | 96 | 100 |
Source: Cost of living index, normalized to US average = 100
Portland, IN Weather
The average high in Portland is 60.8° and the average low is 40.9°.
There are 75.9 days of precipitation each year.
Expect an average of 38.8 inches of precipitation each year with 21.8 inches of snow.
| Stat | Portland |
|---|---|
| Average Annual High | 60.8 |
| Average Annual Low | 40.9 |
| Annual Precipitation Days | 75.9 |
| Average Annual Precipitation | 38.8 |
| Average Annual Snowfall | 21.8 |
Average High
Days of Rain
Source: NOAA climate normals (30-year)
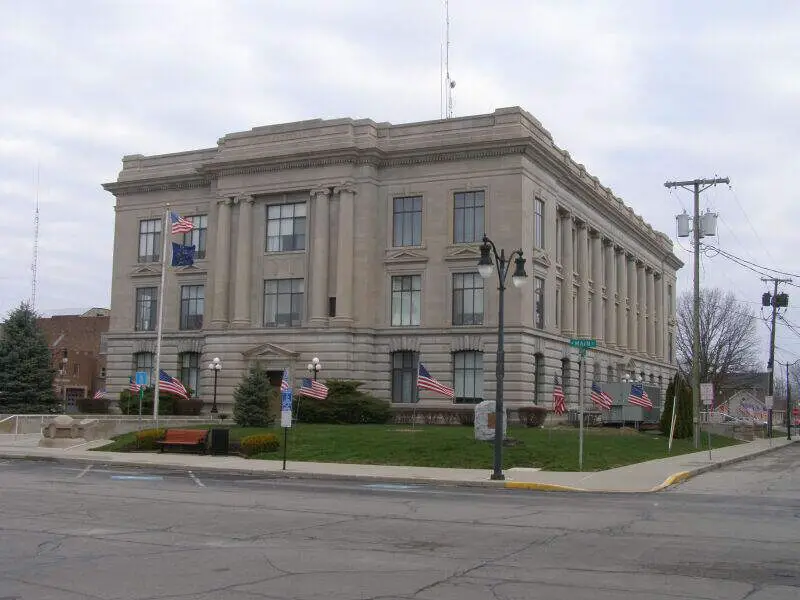
Portland, IN Photos
Rankings & Articles For Portland


Locations Around Portland
Map Of Portland, IN
Best Places Around Portland
Wapakoneta, OH
Population 9,894
St. Marys, OH
Population 8,301
Celina, OH
Population 10,903
Union, OH
Population 7,037
Greenville, OH
Population 12,741
Delphos, OH
Population 7,143
Troy, OH
Population 26,842
Sidney, OH
Population 20,501
Union, KY
Population 7,642
Van Wert, OH
Population 10,790
Portland Demographics And Statistics
Population over time in Portland
The current population in Portland is 6,416. The population has decreased 1.3% from 2010.
| Year | Population | % Change |
|---|---|---|
| 2024 | 6,416 | 1.2% |
| 2023 | 6,341 | -1.4% |
| 2022 | 6,432 | 1.5% |
| 2021 | 6,334 | 6.1% |
| 2020 | 5,972 | 1.5% |
| 2019 | 5,886 | -1.8% |
| 2018 | 5,996 | -1.2% |
| 2017 | 6,068 | -2.5% |
| 2016 | 6,225 | 0.4% |
| 2015 | 6,201 | -3.2% |
| 2014 | 6,408 | -2.0% |
| 2013 | 6,537 | 1.1% |
| 2012 | 6,466 | -1.1% |
| 2011 | 6,538 | 0.6% |
| 2010 | 6,500 | - |
Race / Ethnicity in Portland
See the full breakdown
Portland is:
85.9% White with 5,511 White residents.
0.6% African American with 39 African American residents.
0.0% American Indian with 0 American Indian residents.
0.0% Asian with 0 Asian residents.
0.0% Hawaiian with 0 Hawaiian residents.
0.0% Other with 0 Other residents.
2.4% Two Or More with 152 Two Or More residents.
11.1% Hispanic with 714 Hispanic residents.
| Race | Portland | IN | USA |
|---|---|---|---|
| White | 85.9% | 75.4% | 57.4% |
| African American | 0.6% | 9.1% | 11.9% |
| American Indian | 0.0% | 0.1% | 0.5% |
| Asian | 0.0% | 2.6% | 5.9% |
| Hawaiian | 0.0% | 0.0% | 0.2% |
| Other | 0.0% | 0.4% | 0.6% |
| Two Or More | 2.4% | 3.8% | 4.3% |
| Hispanic | 11.1% | 8.6% | 19.3% |
Gender in Portland
See the full breakdown
Portland is 46.5% female with 2,982 female residents.
Portland is 53.5% male with 3,434 male residents.
| Gender | Portland | IN | USA |
|---|---|---|---|
| Female | 46.5% | 50.4% | 50.5% |
| Male | 53.5% | 49.6% | 49.5% |
Highest level of educational attainment in Portland for adults over 25
See the full breakdown
4.0% of adults in Portland completed < 9th grade.
12.0% of adults in Portland completed 9-12th grade.
43.0% of adults in Portland completed high school / ged.
20.0% of adults in Portland completed some college.
8.0% of adults in Portland completed associate's degree.
8.0% of adults in Portland completed bachelor's degree.
4.0% of adults in Portland completed master's degree.
1.0% of adults in Portland completed professional degree.
0.0% of adults in Portland completed doctorate degree.
| Education | Portland | IN | USA |
|---|---|---|---|
| < 9th Grade | 4.0% | 3.0% | 4.0% |
| 9-12th Grade | 12.0% | 6.0% | 6.0% |
| High School / GED | 43.0% | 33.0% | 26.0% |
| Some College | 20.0% | 19.0% | 19.0% |
| Associate's Degree | 8.0% | 9.0% | 9.0% |
| Bachelor's Degree | 8.0% | 19.0% | 22.0% |
| Master's Degree | 4.0% | 8.0% | 10.0% |
| Professional Degree | 1.0% | 2.0% | 2.0% |
| Doctorate Degree | 0.0% | 1.0% | 2.0% |
Household Income For Portland, Indiana
See the full breakdown
5.3% of households in Portland earn Less than $10,000.
5.2% of households in Portland earn $10,000 to $14,999.
11.5% of households in Portland earn $15,000 to $24,999.
11.6% of households in Portland earn $25,000 to $34,999.
13.7% of households in Portland earn $35,000 to $49,999.
17.8% of households in Portland earn $50,000 to $74,999.
13.1% of households in Portland earn $75,000 to $99,999.
13.7% of households in Portland earn $100,000 to $149,999.
5.5% of households in Portland earn $150,000 to $199,999.
2.6% of households in Portland earn $200,000 or more.
| Income | Portland | IN | USA |
|---|---|---|---|
| Less than $10,000 | 5.3% | 4.9% | 5.0% |
| $10,000 to $14,999 | 5.2% | 3.4% | 3.4% |
| $15,000 to $24,999 | 11.5% | 6.8% | 6.3% |
| $25,000 to $34,999 | 11.6% | 7.5% | 6.6% |
| $35,000 to $49,999 | 13.7% | 11.8% | 10.1% |
| $50,000 to $74,999 | 17.8% | 17.7% | 15.5% |
| $75,000 to $99,999 | 13.1% | 13.9% | 12.6% |
| $100,000 to $149,999 | 13.7% | 17.5% | 17.5% |
| $150,000 to $199,999 | 5.5% | 8.3% | 9.6% |
| $200,000 or more | 2.6% | 8.2% | 13.4% |
Source: U.S. Census ACS 5-year estimates (2024)


