Troy SnackAbility
Overall SnackAbility
Crime in Troy summary. We use data from the FBI to determine the crime rates in Troy. Key points include:
There were 339 total crimes in Troy in the last reporting year.
The overall crime rate per 100,000 people in Troy is 1,255.2 / 100k people.
The violent crime rate per 100,000 people in Troy is 140.7 / 100k people.
The property crime rate per 100,000 people in Troy is 1,114.5 / 100k people.
Overall, crime in Troy is -40.77% below the national average.
Total Crimes
Below National Average
Crime In Troy Comparison Table
| Statistic | Count Raw |
Troy / 100k People |
Ohio / 100k People |
National / 100k People |
|---|---|---|---|---|
| Total Crimes Per 100K | 339 | 1,255.2 | 1,844.9 | 2,119.2 |
| Violent Crime | 38 | 140.7 | 293.7 | 359.0 |
| Murder | 0 | 0.0 | 5.0 | 5.0 |
| Robbery | 4 | 14.8 | 45.5 | 61.0 |
| Aggravated Assault | 18 | 66.6 | 197.4 | 256.0 |
| Property Crime | 301 | 1,114.5 | 1,551.2 | 1,760.0 |
| Burglary | 36 | 133.3 | 206.0 | 229.0 |
| Larceny | 245 | 907.1 | 1,132.8 | 1,272.0 |
| Car Theft | 20 | 74.1 | 212.5 | 259.0 |
Source: FBI Uniform Crime Reporting (2024)
Cost of living in Troy summary. We use data on the cost of living to determine how expensive it is to live in Troy. Real estate prices drive most of the variance in cost of living around Ohio. Key points include:
The cost of living in Troy is 92 with 100 being average.
The cost of living in Troy is 0.9x lower than the national average.
The median home value in Troy is $280,153.
The median income in Troy is $68,830.
Troy's Overall Cost Of Living
Lower Than The National Average
Cost Of Living In Troy Comparison Table
| Living Expense | Troy | Ohio | National Average |
|---|---|---|---|
| Overall | 92 | 90 | 100 |
| Services | 97 | 97 | 100 |
| Groceries | 98 | 97 | 100 |
| Health | 82 | 75 | 100 |
| Housing | 92 | 97 | 100 |
| Transportation | 97 | 95 | 100 |
| Utilities | 93 | 97 | 100 |
Source: Cost of living index, normalized to US average = 100
Troy, OH Weather
The average high in Troy is 61.4° and the average low is 42.0°.
There are 77.7 days of precipitation each year.
Expect an average of 39.9 inches of precipitation each year with 15.4 inches of snow.
| Stat | Troy |
|---|---|
| Average Annual High | 61.4 |
| Average Annual Low | 42.0 |
| Annual Precipitation Days | 77.7 |
| Average Annual Precipitation | 39.9 |
| Average Annual Snowfall | 15.4 |
Average High
Days of Rain
Source: NOAA climate normals (30-year)
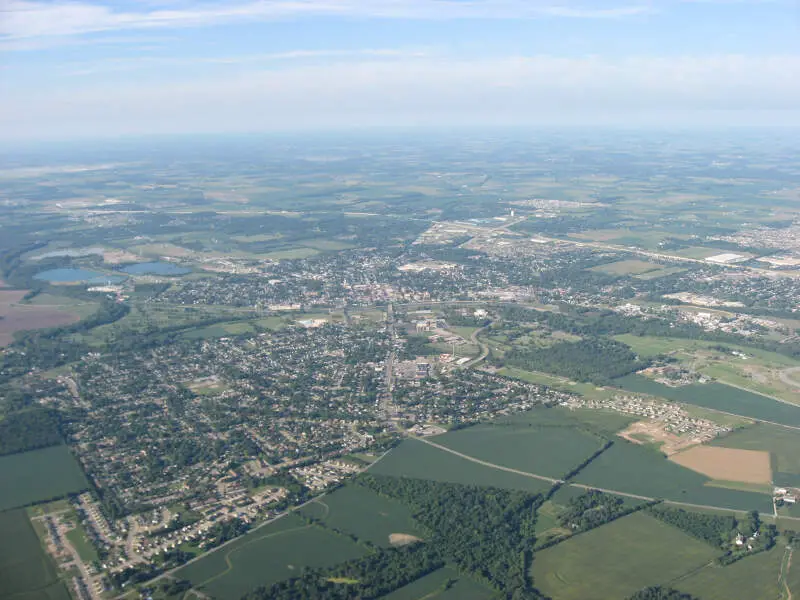
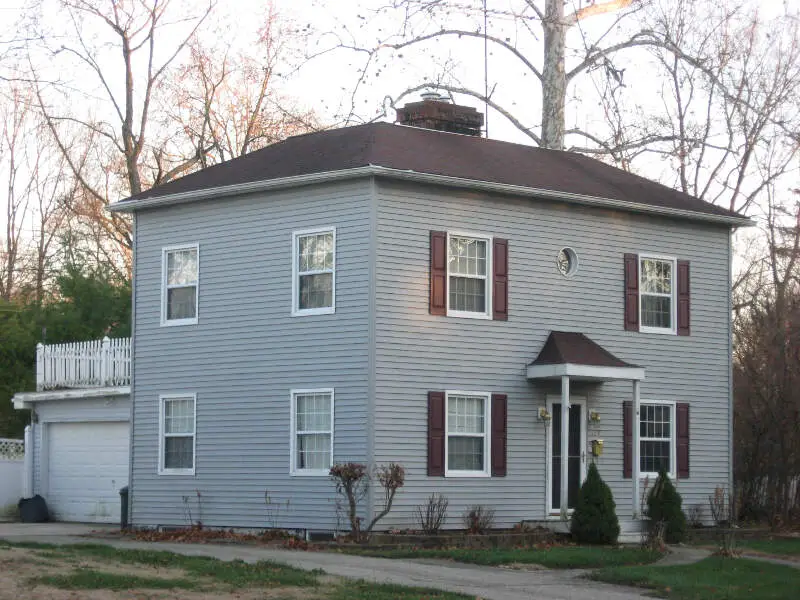
Troy, OH Photos


Rankings & Articles For Troy


Locations Around Troy
Map Of Troy, OH
Best Places Around Troy
Clayton, OH
Population 13,277
Vandalia, OH
Population 15,053
Brookville, OH
Population 5,779
Huber Heights, OH
Population 43,455
Englewood, OH
Population 13,356
Union, OH
Population 7,037
Sidney, OH
Population 20,501
Riverside, OH
Population 24,435
New Carlisle, OH
Population 5,544
Troy Demographics And Statistics
Population over time in Troy
The current population in Troy is 26,842. The population has increased 8.1% from 2010.
| Year | Population | % Change |
|---|---|---|
| 2024 | 26,842 | 0.5% |
| 2023 | 26,716 | 0.8% |
| 2022 | 26,494 | 1.5% |
| 2021 | 26,093 | -0.3% |
| 2020 | 26,176 | 0.8% |
| 2019 | 25,961 | 0.3% |
| 2018 | 25,894 | 0.8% |
| 2017 | 25,694 | 0.0% |
| 2016 | 25,684 | 1.1% |
| 2015 | 25,411 | 0.3% |
| 2014 | 25,334 | 0.8% |
| 2013 | 25,134 | 0.3% |
| 2012 | 25,069 | 0.4% |
| 2011 | 24,959 | 0.5% |
| 2010 | 24,828 | - |
Race / Ethnicity in Troy
See the full breakdown
Troy is:
83.4% White with 22,390 White residents.
3.3% African American with 877 African American residents.
0.0% American Indian with 0 American Indian residents.
4.0% Asian with 1,073 Asian residents.
0.0% Hawaiian with 0 Hawaiian residents.
0.5% Other with 130 Other residents.
5.9% Two Or More with 1,586 Two Or More residents.
2.9% Hispanic with 786 Hispanic residents.
| Race | Troy | OH | USA |
|---|---|---|---|
| White | 83.4% | 75.8% | 57.4% |
| African American | 3.3% | 12.0% | 11.9% |
| American Indian | 0.0% | 0.1% | 0.5% |
| Asian | 4.0% | 2.5% | 5.9% |
| Hawaiian | 0.0% | 0.0% | 0.2% |
| Other | 0.5% | 0.4% | 0.6% |
| Two Or More | 5.9% | 4.3% | 4.3% |
| Hispanic | 2.9% | 4.8% | 19.3% |
Gender in Troy
See the full breakdown
Troy is 50.2% female with 13,463 female residents.
Troy is 49.8% male with 13,378 male residents.
| Gender | Troy | OH | USA |
|---|---|---|---|
| Female | 50.2% | 50.7% | 50.5% |
| Male | 49.8% | 49.3% | 49.5% |
Highest level of educational attainment in Troy for adults over 25
See the full breakdown
1.0% of adults in Troy completed < 9th grade.
6.0% of adults in Troy completed 9-12th grade.
33.0% of adults in Troy completed high school / ged.
16.0% of adults in Troy completed some college.
11.0% of adults in Troy completed associate's degree.
20.0% of adults in Troy completed bachelor's degree.
11.0% of adults in Troy completed master's degree.
1.0% of adults in Troy completed professional degree.
1.0% of adults in Troy completed doctorate degree.
| Education | Troy | OH | USA |
|---|---|---|---|
| < 9th Grade | 1.0% | 3.0% | 4.0% |
| 9-12th Grade | 6.0% | 6.0% | 6.0% |
| High School / GED | 33.0% | 32.0% | 26.0% |
| Some College | 16.0% | 19.0% | 19.0% |
| Associate's Degree | 11.0% | 9.0% | 9.0% |
| Bachelor's Degree | 20.0% | 19.0% | 22.0% |
| Master's Degree | 11.0% | 9.0% | 10.0% |
| Professional Degree | 1.0% | 2.0% | 2.0% |
| Doctorate Degree | 1.0% | 1.0% | 2.0% |
Household Income For Troy, Ohio
See the full breakdown
2.9% of households in Troy earn Less than $10,000.
4.9% of households in Troy earn $10,000 to $14,999.
8.8% of households in Troy earn $15,000 to $24,999.
6.3% of households in Troy earn $25,000 to $34,999.
11.9% of households in Troy earn $35,000 to $49,999.
19.8% of households in Troy earn $50,000 to $74,999.
12.9% of households in Troy earn $75,000 to $99,999.
17.1% of households in Troy earn $100,000 to $149,999.
7.2% of households in Troy earn $150,000 to $199,999.
8.2% of households in Troy earn $200,000 or more.
| Income | Troy | OH | USA |
|---|---|---|---|
| Less than $10,000 | 2.9% | 5.2% | 5.0% |
| $10,000 to $14,999 | 4.9% | 4.0% | 3.4% |
| $15,000 to $24,999 | 8.8% | 7.1% | 6.3% |
| $25,000 to $34,999 | 6.3% | 7.5% | 6.6% |
| $35,000 to $49,999 | 11.9% | 11.6% | 10.1% |
| $50,000 to $74,999 | 19.8% | 16.9% | 15.5% |
| $75,000 to $99,999 | 12.9% | 13.1% | 12.6% |
| $100,000 to $149,999 | 17.1% | 17.1% | 17.5% |
| $150,000 to $199,999 | 7.2% | 8.3% | 9.6% |
| $200,000 or more | 8.2% | 9.1% | 13.4% |
Source: U.S. Census ACS 5-year estimates (2024)


