Wabash SnackAbility
Overall SnackAbility
Cost of living in Wabash summary. We use data on the cost of living to determine how expensive it is to live in Wabash. Real estate prices drive most of the variance in cost of living around Indiana. Key points include:
The cost of living in Wabash is 82 with 100 being average.
The cost of living in Wabash is 0.8x lower than the national average.
The median home value in Wabash is $179,808.
The median income in Wabash is $53,410.
Wabash's Overall Cost Of Living
Lower Than The National Average
Cost Of Living In Wabash Comparison Table
| Living Expense | Wabash | Indiana | National Average |
|---|---|---|---|
| Overall | 82 | 90 | 100 |
| Services | 97 | 97 | 100 |
| Groceries | 95 | 95 | 100 |
| Health | 54 | 72 | 100 |
| Housing | 97 | 98 | 100 |
| Transportation | 100 | 94 | 100 |
| Utilities | 94 | 96 | 100 |
Source: Cost of living index, normalized to US average = 100
Wabash, IN Weather
The average high in Wabash is 60.2° and the average low is 40.4°.
There are 78.7 days of precipitation each year.
Expect an average of 39.9 inches of precipitation each year with 28.9 inches of snow.
| Stat | Wabash |
|---|---|
| Average Annual High | 60.2 |
| Average Annual Low | 40.4 |
| Annual Precipitation Days | 78.7 |
| Average Annual Precipitation | 39.9 |
| Average Annual Snowfall | 28.9 |
Average High
Days of Rain
Source: NOAA climate normals (30-year)
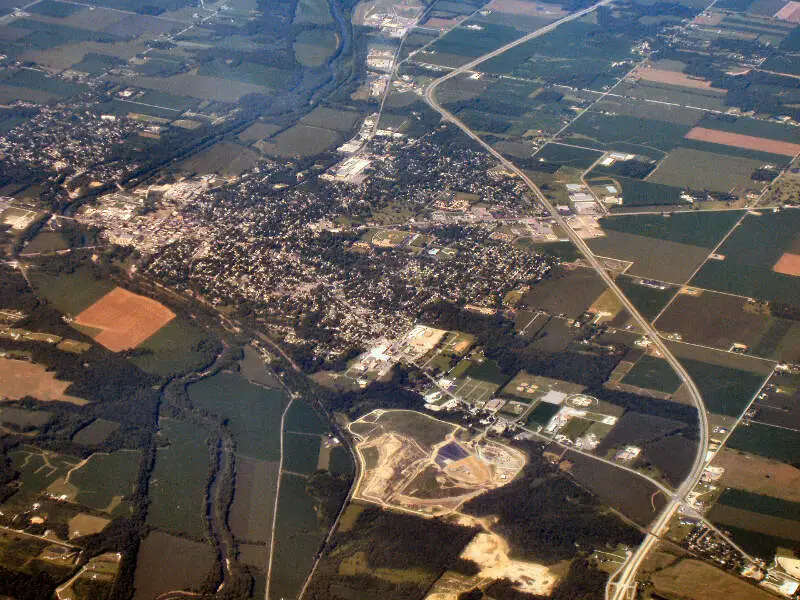
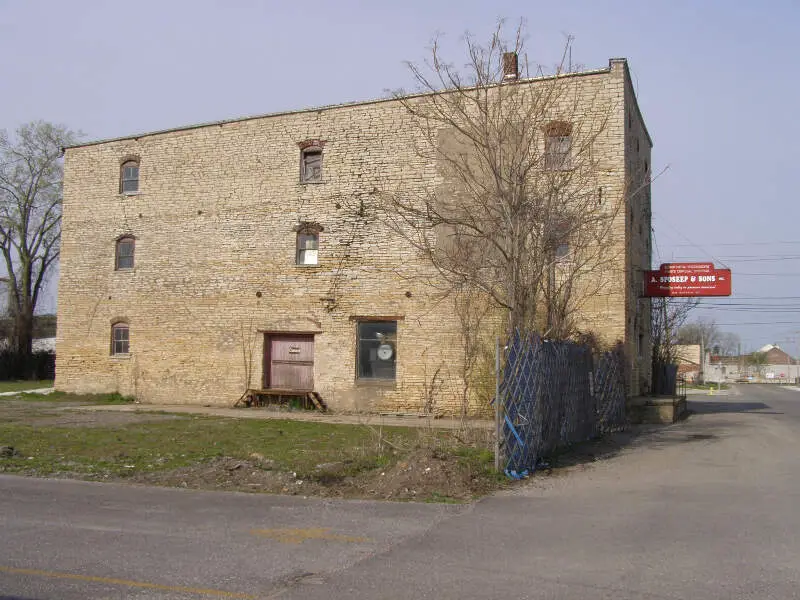
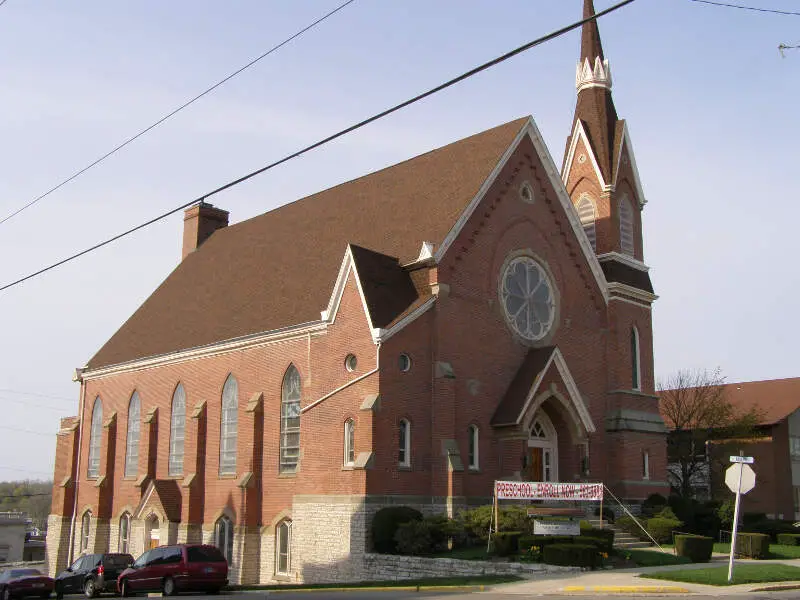
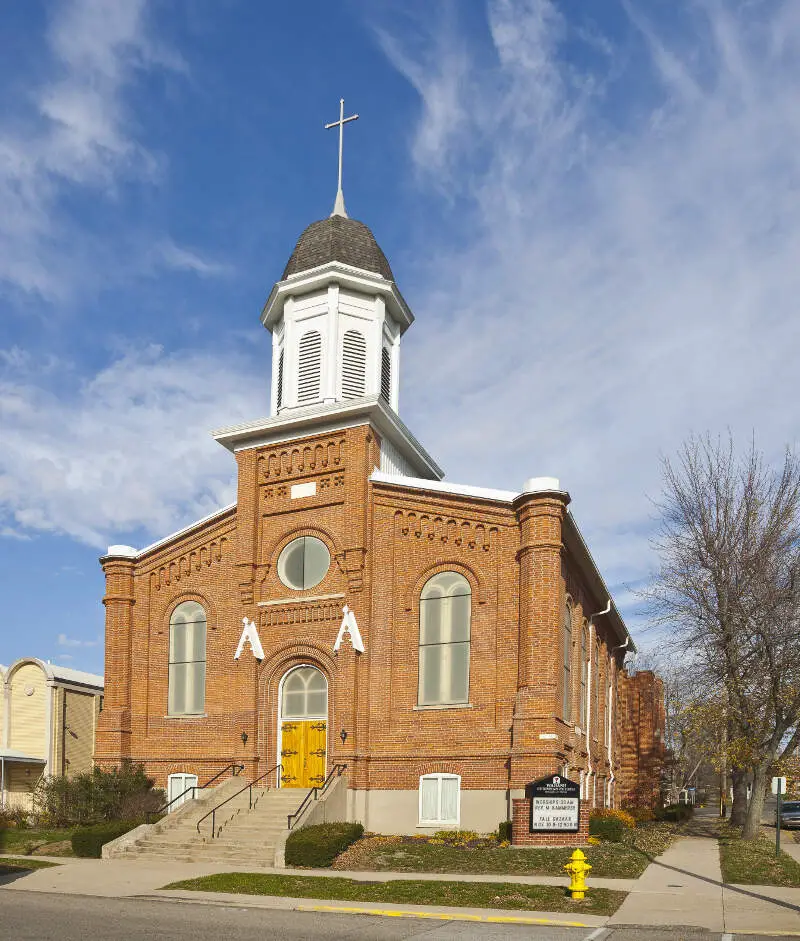
Wabash, IN Photos


Rankings & Articles For Wabash


Locations Around Wabash
Map Of Wabash, IN
Best Places Around Wabash
Decatur, IN
Population 9,811
Nappanee, IN
Population 6,815
Fort Wayne, IN
Population 268,589
Warsaw, IN
Population 16,768
North Manchester, IN
Population 4,819
New Haven, IN
Population 15,698
Monticello, IN
Population 5,496
Huntington, IN
Population 17,030
Kokomo, IN
Population 59,122
Wabash Demographics And Statistics
Population over time in Wabash
The current population in Wabash is 10,358. The population has decreased 4.5% from 2010.
| Year | Population | % Change |
|---|---|---|
| 2024 | 10,358 | -0.2% |
| 2023 | 10,378 | -0.4% |
| 2022 | 10,417 | -0.0% |
| 2021 | 10,420 | 4.0% |
| 2020 | 10,017 | -0.7% |
| 2019 | 10,089 | -0.9% |
| 2018 | 10,184 | -0.9% |
| 2017 | 10,272 | -1.4% |
| 2016 | 10,414 | -0.5% |
| 2015 | 10,469 | -0.6% |
| 2014 | 10,534 | -0.6% |
| 2013 | 10,598 | -0.4% |
| 2012 | 10,644 | -0.8% |
| 2011 | 10,735 | -1.0% |
| 2010 | 10,847 | - |
Race / Ethnicity in Wabash
See the full breakdown
Wabash is:
90.4% White with 9,361 White residents.
0.3% African American with 27 African American residents.
0.0% American Indian with 0 American Indian residents.
0.5% Asian with 49 Asian residents.
0.0% Hawaiian with 0 Hawaiian residents.
0.1% Other with 15 Other residents.
3.2% Two Or More with 330 Two Or More residents.
5.6% Hispanic with 576 Hispanic residents.
| Race | Wabash | IN | USA |
|---|---|---|---|
| White | 90.4% | 75.4% | 57.4% |
| African American | 0.3% | 9.1% | 11.9% |
| American Indian | 0.0% | 0.1% | 0.5% |
| Asian | 0.5% | 2.6% | 5.9% |
| Hawaiian | 0.0% | 0.0% | 0.2% |
| Other | 0.1% | 0.4% | 0.6% |
| Two Or More | 3.2% | 3.8% | 4.3% |
| Hispanic | 5.6% | 8.6% | 19.3% |
Gender in Wabash
See the full breakdown
Wabash is 50.6% female with 5,242 female residents.
Wabash is 49.4% male with 5,116 male residents.
| Gender | Wabash | IN | USA |
|---|---|---|---|
| Female | 50.6% | 50.4% | 50.5% |
| Male | 49.4% | 49.6% | 49.5% |
Highest level of educational attainment in Wabash for adults over 25
See the full breakdown
3.0% of adults in Wabash completed < 9th grade.
7.0% of adults in Wabash completed 9-12th grade.
42.0% of adults in Wabash completed high school / ged.
16.0% of adults in Wabash completed some college.
8.0% of adults in Wabash completed associate's degree.
17.0% of adults in Wabash completed bachelor's degree.
6.0% of adults in Wabash completed master's degree.
0.0% of adults in Wabash completed professional degree.
1.0% of adults in Wabash completed doctorate degree.
| Education | Wabash | IN | USA |
|---|---|---|---|
| < 9th Grade | 3.0% | 3.0% | 4.0% |
| 9-12th Grade | 7.0% | 6.0% | 6.0% |
| High School / GED | 42.0% | 33.0% | 26.0% |
| Some College | 16.0% | 19.0% | 19.0% |
| Associate's Degree | 8.0% | 9.0% | 9.0% |
| Bachelor's Degree | 17.0% | 19.0% | 22.0% |
| Master's Degree | 6.0% | 8.0% | 10.0% |
| Professional Degree | 0.0% | 2.0% | 2.0% |
| Doctorate Degree | 1.0% | 1.0% | 2.0% |
Household Income For Wabash, Indiana
See the full breakdown
4.5% of households in Wabash earn Less than $10,000.
6.1% of households in Wabash earn $10,000 to $14,999.
10.2% of households in Wabash earn $15,000 to $24,999.
9.2% of households in Wabash earn $25,000 to $34,999.
17.0% of households in Wabash earn $35,000 to $49,999.
19.5% of households in Wabash earn $50,000 to $74,999.
10.3% of households in Wabash earn $75,000 to $99,999.
15.2% of households in Wabash earn $100,000 to $149,999.
5.7% of households in Wabash earn $150,000 to $199,999.
2.5% of households in Wabash earn $200,000 or more.
| Income | Wabash | IN | USA |
|---|---|---|---|
| Less than $10,000 | 4.5% | 4.9% | 5.0% |
| $10,000 to $14,999 | 6.1% | 3.4% | 3.4% |
| $15,000 to $24,999 | 10.2% | 6.8% | 6.3% |
| $25,000 to $34,999 | 9.2% | 7.5% | 6.6% |
| $35,000 to $49,999 | 17.0% | 11.8% | 10.1% |
| $50,000 to $74,999 | 19.5% | 17.7% | 15.5% |
| $75,000 to $99,999 | 10.3% | 13.9% | 12.6% |
| $100,000 to $149,999 | 15.2% | 17.5% | 17.5% |
| $150,000 to $199,999 | 5.7% | 8.3% | 9.6% |
| $200,000 or more | 2.5% | 8.2% | 13.4% |
Source: U.S. Census ACS 5-year estimates (2024)


