Fort Wayne, IN
Demographics And Statistics
Living In Fort Wayne, Indiana Summary
Life in Fort Wayne research summary. HomeSnacks has been using Saturday Night Science to research the quality of life in Fort Wayne over the past nine years using Census, FBI, Zillow, and other primary data sources. Based on the most recently available data, we found the following about life in Fort Wayne:
The population in Fort Wayne is 266,235.
The median home value in Fort Wayne is $237,567.
The median income in Fort Wayne is $60,293.
The cost of living in Fort Wayne is 91 which is 0.9x lower than the national average.
The median rent in Fort Wayne is $959.
The unemployment rate in Fort Wayne is 5.5%.
The poverty rate in Fort Wayne is 15.6%.
The average high in Fort Wayne is 60.2° and the average low is 40.5°.
Fort Wayne SnackAbility
Overall SnackAbility
Fort Wayne, IN Crime Report
Crime in Fort Wayne summary. We use data from the FBI to determine the crime rates in Fort Wayne. Key points include:
There were 6,882 total crimes in Fort Wayne in the last reporting year.
The overall crime rate per 100,000 people in Fort Wayne is 2,531.2 / 100k people.
The violent crime rate per 100,000 people in Fort Wayne is 307.5 / 100k people.
The property crime rate per 100,000 people in Fort Wayne is 2,223.7 / 100k people.
Overall, crime in Fort Wayne is 19.44% above the national average.
Total Crimes
Above National Average
Crime In Fort Wayne Comparison Table
| Statistic | Count Raw |
Fort Wayne / 100k People |
Indiana / 100k People |
National / 100k People |
|---|---|---|---|---|
| Total Crimes Per 100K | 6,882 | 2,531.2 | 1,691.5 | 2,119.2 |
| Violent Crime | 836 | 307.5 | 312.9 | 359.0 |
| Murder | 30 | 11.0 | 5.5 | 5.0 |
| Robbery | 149 | 54.8 | 34.5 | 61.0 |
| Aggravated Assault | 541 | 199.0 | 239.4 | 256.0 |
| Property Crime | 6,046 | 2,223.7 | 1,378.6 | 1,760.0 |
| Burglary | 591 | 217.4 | 176.8 | 229.0 |
| Larceny | 4,735 | 1,741.5 | 988.8 | 1,272.0 |
| Car Theft | 720 | 264.8 | 213.0 | 259.0 |
Fort Wayne, IN Cost Of Living
Cost of living in Fort Wayne summary. We use data on the cost of living to determine how expensive it is to live in Fort Wayne. Real estate prices drive most of the variance in cost of living around Indiana. Key points include:
The cost of living in Fort Wayne is 91 with 100 being average.
The cost of living in Fort Wayne is 0.9x lower than the national average.
The median home value in Fort Wayne is $237,567.
The median income in Fort Wayne is $60,293.
Fort Wayne's Overall Cost Of Living
Lower Than The National Average
Cost Of Living In Fort Wayne Comparison Table
| Living Expense | Fort Wayne | Indiana | National Average | |
|---|---|---|---|---|
| Overall | 91 | 92 | 100 | |
| Services | 94 | 95 | 100 | |
| Groceries | 100 | 97 | 100 | |
| Health | 96 | 94 | 100 | |
| Housing | 73 | 73 | 100 | |
| Transportation | 100 | 94 | 100 | |
| Utilities | 102 | 107 | 100 | |
Fort Wayne, IN Weather
The average high in Fort Wayne is 60.2° and the average low is 40.5°.
There are 77.0 days of precipitation each year.
Expect an average of 37.0 inches of precipitation each year with 31.8 inches of snow.
| Stat | Fort Wayne |
|---|---|
| Average Annual High | 60.2 |
| Average Annual Low | 40.5 |
| Annual Precipitation Days | 77.0 |
| Average Annual Precipitation | 37.0 |
| Average Annual Snowfall | 31.8 |
Average High
Days of Rain
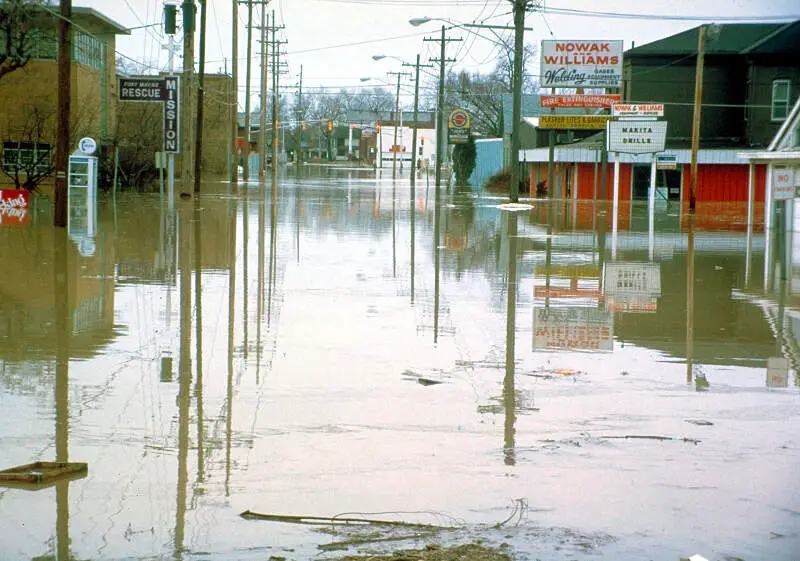
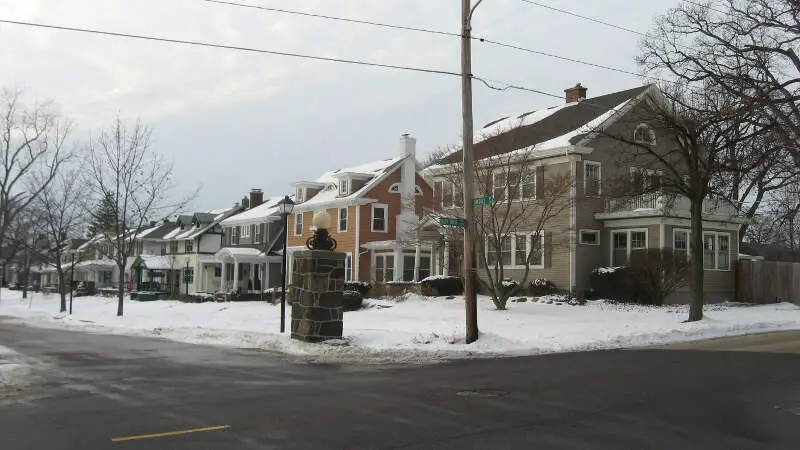
Fort Wayne, IN Photos


2 Reviews & Comments About Fort Wayne
/5

skrilla gaming - None
I live in fort Wayne which is in Indiana and it's terrible
HomeSnacks User - 2019-02-27 09:34:53.554430
Fort Wayne is great if you want a low cost of housing, reasonable jobs, have children, love to go to church, and don't mind terrible weather. It's terrible in every other way. It's backward, polluted, close-minded, boring, and the weather is truly some of the worst in the country. I lived most of my life there. Finally left and moved to Hawaii! Most people stay in Indiana because of family, or because they are afraid of the outside world.
What stood out- First and foremost: the weather. I cannot *stress* to you how bad the weather is. The year before we left, the winter low got down to -16; the next summer, we hit 111. Seriously. I was so out of shape, 30+ pounds over weight, because YOU CANNOT BE OUTSIDE most times of the year!
Some people are nice, but it's a bit like little Chicago. There is more road-rage in this small city than there needs to be. The water quality is not good, and the air quality is worse. People here are generally very unhappy, and LOVE to gossip. WHY- because there's nothing else to do.
On the plus side, it's easy to survive there. Housing is relatively inexpensive, groceries are cheap, gas is reasonable. Utilities are actually on the expensive side. There are some decent restaurants. The arts and cultural scene is bland, but at least they attempt to create something given the geographic isolation.
Mostly, what stands out to me is simply the feeling of desolation and hopelessness that I felt when I lived there.
Fort Wayne Articles

Rankings for Fort Wayne in Indiana


Locations Around Fort Wayne
Map Of Fort Wayne, IN
Best Places Around Fort Wayne
Oakwood, OH
Population 9,480
Celina, OH
Population 11,017
Delphos, OH
Population 7,063
Defiance, OH
Population 16,830
Bryan, OH
Population 8,664
Van Wert, OH
Population 10,710
Decatur, IN
Population 9,769
Goshen, IN
Population 34,374
Garrett, IN
Population 6,540
Auburn, IN
Population 13,464
Fort Wayne Demographics And Statistics
Population over time in Fort Wayne
The current population in Fort Wayne is 266,235. The population has increased 4.9% from 2010.
| Year | Population | % Change |
|---|---|---|
| 2023 | 266,235 | 0.7% |
| 2022 | 264,514 | 0.7% |
| 2021 | 262,676 | -2.1% |
| 2020 | 268,378 | 1.0% |
| 2019 | 265,752 | 0.6% |
| 2018 | 264,052 | 0.6% |
| 2017 | 262,450 | 0.6% |
| 2016 | 260,954 | 1.5% |
| 2015 | 257,059 | 0.5% |
| 2014 | 255,784 | 0.5% |
| 2013 | 254,435 | 0.3% |
| 2012 | 253,617 | -0.2% |
| 2011 | 254,228 | 0.2% |
| 2010 | 253,721 | - |
Race / Ethnicity in Fort Wayne
Fort Wayne is:
63.8% White with 169,757 White residents.
14.4% African American with 38,259 African American residents.
0.1% American Indian with 167 American Indian residents.
5.8% Asian with 15,457 Asian residents.
0.0% Hawaiian with 100 Hawaiian residents.
0.3% Other with 899 Other residents.
5.1% Two Or More with 13,558 Two Or More residents.
10.5% Hispanic with 28,038 Hispanic residents.
| Race | Fort Wayne | IN | USA |
|---|---|---|---|
| White | 63.8% | 76.1% | 58.2% |
| African American | 14.4% | 9.1% | 12.0% |
| American Indian | 0.1% | 0.1% | 0.5% |
| Asian | 5.8% | 2.5% | 5.7% |
| Hawaiian | 0.0% | 0.0% | 0.2% |
| Other | 0.3% | 0.4% | 0.5% |
| Two Or More | 5.1% | 3.4% | 3.9% |
| Hispanic | 10.5% | 8.4% | 19.0% |
Gender in Fort Wayne
Fort Wayne is 51.2% female with 136,276 female residents.
Fort Wayne is 48.8% male with 129,959 male residents.
| Gender | Fort Wayne | IN | USA |
|---|---|---|---|
| Female | 51.2% | 50.4% | 50.5% |
| Male | 48.8% | 49.6% | 49.5% |
Highest level of educational attainment in Fort Wayne for adults over 25
5.0% of adults in Fort Wayne completed < 9th grade.
6.0% of adults in Fort Wayne completed 9-12th grade.
29.0% of adults in Fort Wayne completed high school / ged.
22.0% of adults in Fort Wayne completed some college.
10.0% of adults in Fort Wayne completed associate's degree.
19.0% of adults in Fort Wayne completed bachelor's degree.
7.0% of adults in Fort Wayne completed master's degree.
1.0% of adults in Fort Wayne completed professional degree.
1.0% of adults in Fort Wayne completed doctorate degree.
| Education | Fort Wayne | IN | USA |
|---|---|---|---|
| < 9th Grade | 5.0% | 3.0% | 5.0% |
| 9-12th Grade | 6.0% | 6.0% | 6.0% |
| High School / GED | 29.0% | 33.0% | 26.0% |
| Some College | 22.0% | 20.0% | 19.0% |
| Associate's Degree | 10.0% | 9.0% | 9.0% |
| Bachelor's Degree | 19.0% | 18.0% | 21.0% |
| Master's Degree | 7.0% | 8.0% | 10.0% |
| Professional Degree | 1.0% | 2.0% | 2.0% |
| Doctorate Degree | 1.0% | 1.0% | 2.0% |
Household Income For Fort Wayne, Indiana
5.4% of households in Fort Wayne earn Less than $10,000.
3.9% of households in Fort Wayne earn $10,000 to $14,999.
7.9% of households in Fort Wayne earn $15,000 to $24,999.
9.6% of households in Fort Wayne earn $25,000 to $34,999.
14.5% of households in Fort Wayne earn $35,000 to $49,999.
19.5% of households in Fort Wayne earn $50,000 to $74,999.
14.1% of households in Fort Wayne earn $75,000 to $99,999.
15.2% of households in Fort Wayne earn $100,000 to $149,999.
5.2% of households in Fort Wayne earn $150,000 to $199,999.
4.7% of households in Fort Wayne earn $200,000 or more.
| Income | Fort Wayne | IN | USA |
|---|---|---|---|
| Less than $10,000 | 5.4% | 4.9% | 4.9% |
| $10,000 to $14,999 | 3.9% | 3.5% | 3.6% |
| $15,000 to $24,999 | 7.9% | 7.1% | 6.6% |
| $25,000 to $34,999 | 9.6% | 7.8% | 6.8% |
| $35,000 to $49,999 | 14.5% | 12.2% | 10.4% |
| $50,000 to $74,999 | 19.5% | 17.9% | 15.7% |
| $75,000 to $99,999 | 14.1% | 13.9% | 12.7% |
| $100,000 to $149,999 | 15.2% | 17.2% | 17.4% |
| $150,000 to $199,999 | 5.2% | 7.9% | 9.3% |
| $200,000 or more | 4.7% | 7.6% | 12.6% |


